Did the carvings survive?
On 22 August 2026 the Hawk Fire burned through a spring-fed aspen grove on Peavine Mountain — an old Basque sheep camp where a century of sheepherders carved their names into the bark. This page watches what happens next, from free public satellite data, updated every time Sentinel-2 passes over.
Why there was anything there to burn
A watershed run over USGS elevation puts the cache almost exactly on a drainage line: 214 cells of flow accumulation, 31 metres from a mapped channel. A parking area 500 metres away scores 1 — flat, dry ridge. That contrast is the whole geography of the site in two numbers. Water finds this exact spot on the mountain, and has for a very long time.
The spring is why the grove is there. The grove is why the sheepherders camped there. The camping is why the carvings are there. Hold on to that chain — it comes back further down, and it isn’t kind.
Ninety-two minutes
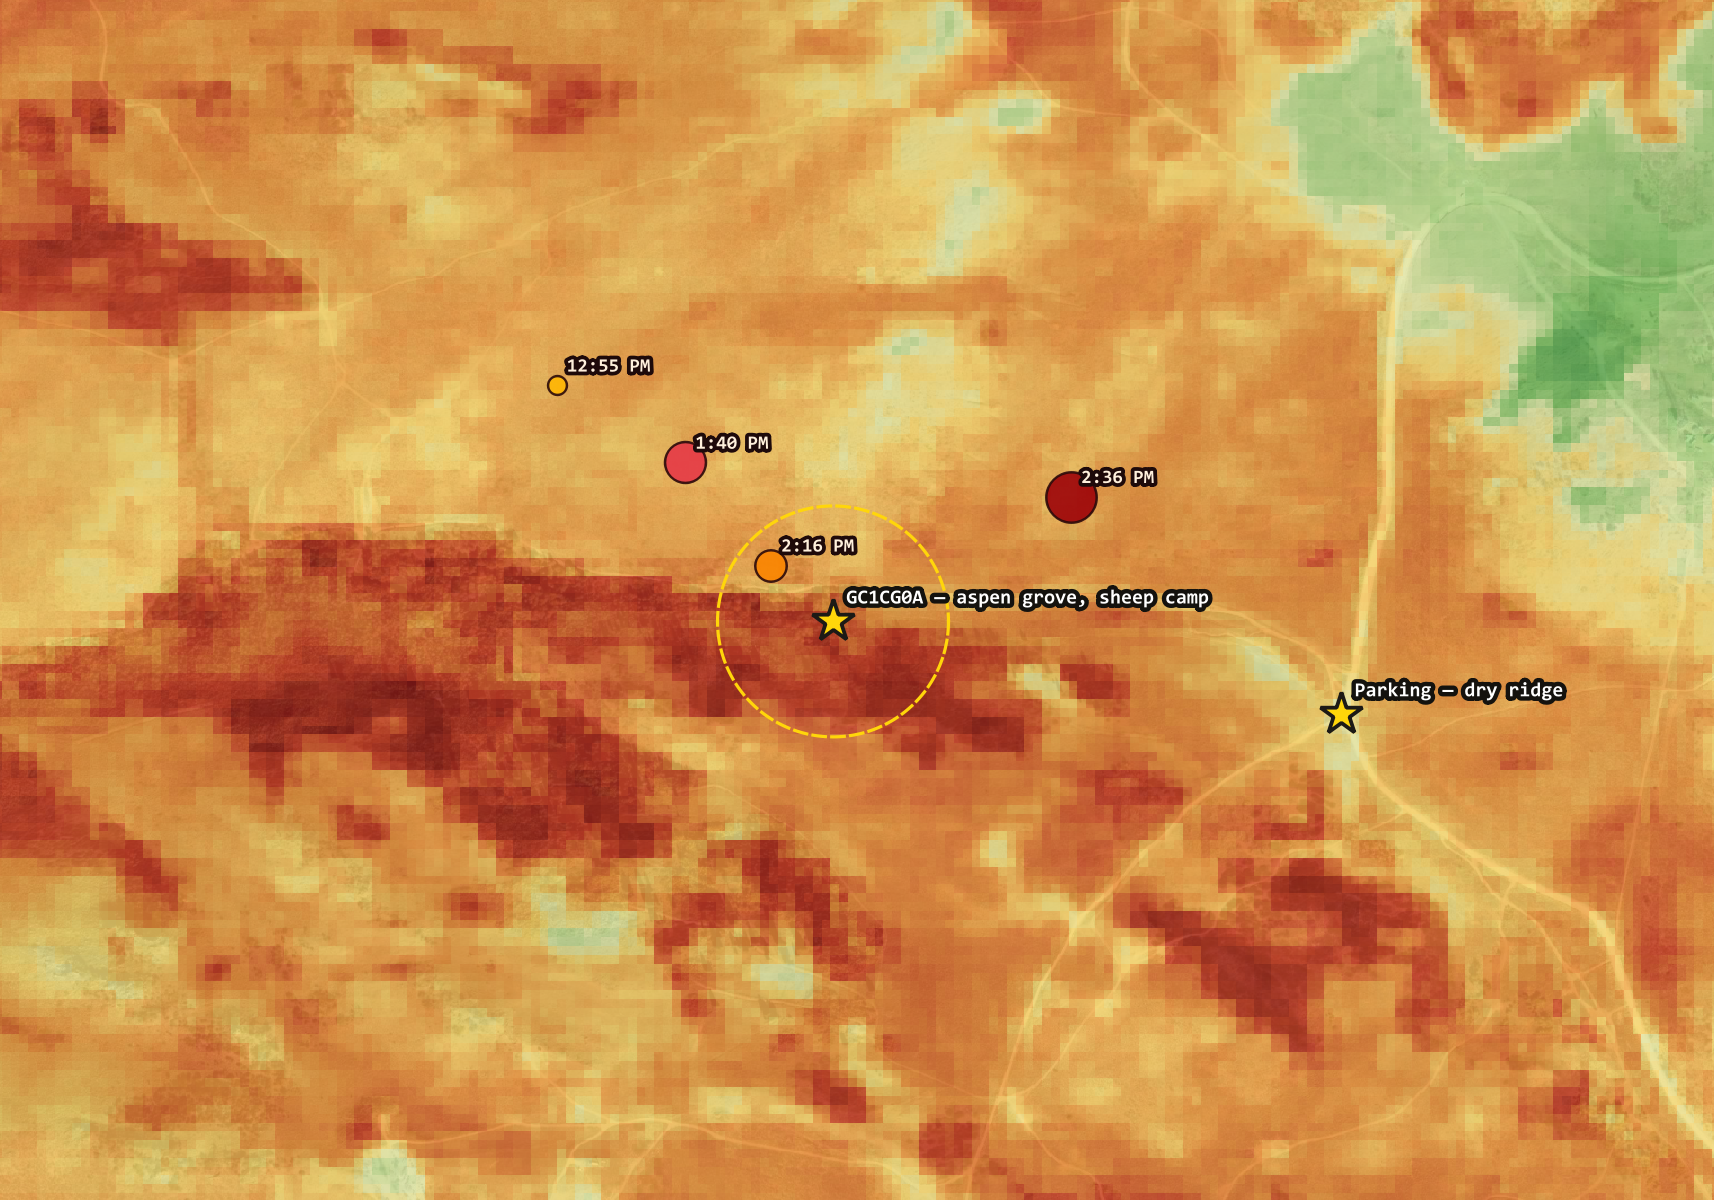
VIIRS is a thermal sensor on two polar-orbiting satellites. It doesn’t usually let you watch a fire arrive at a specific coordinate — but Hawk moved fast enough, and the passes lined up well enough, that here it basically does.
Fire arrival at the cache · 22 August 2026
| Time (PDT) | Distance | What VIIRS saw |
|---|---|---|
| 11:23 AM | — | Ignition |
| 12:55 PM | 315 m | First detection, 92 min after ignition |
| 1:40 PM | 222 m | High confidence, 216 MW |
| 2:16 PM | 79 m | High confidence, 142.7 MW |
| 2:36 PM | 282 m | 230 MW |
Ninety minutes to close 236 metres. Brightness temperature saturated the sensor’s ceiling at 367 K on most of these — it could not register anything hotter. At the cache pixel, NDVI fell from 0.776 to 0.217: closed healthy canopy to bare soil. This was not a surface fire that ran underneath and scorched some trunks. The crown went.
Terrain, or just more fuel?
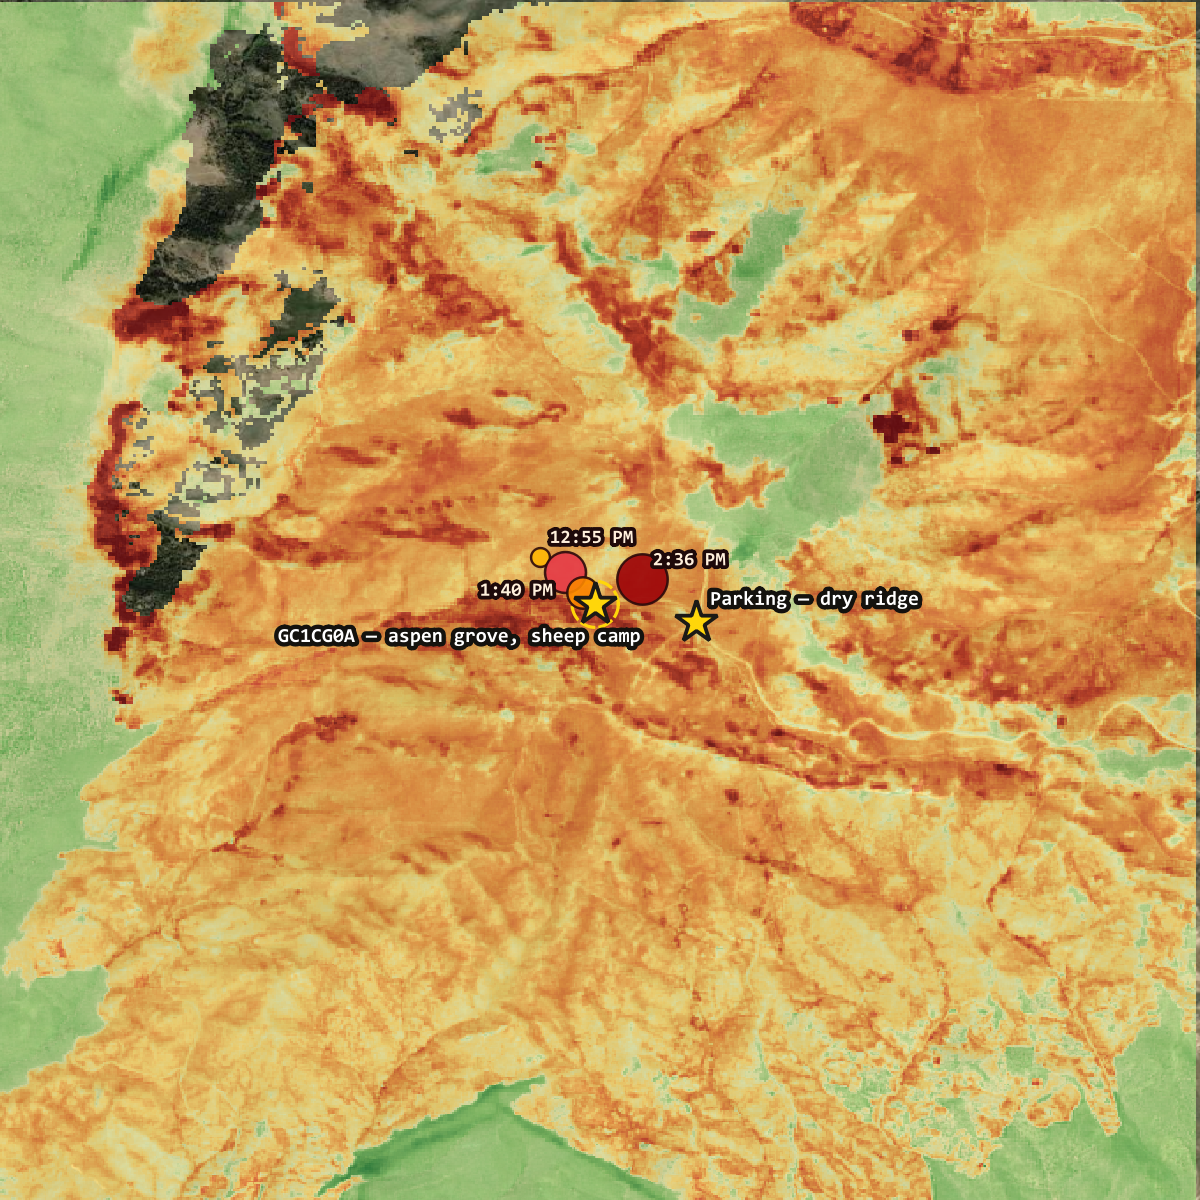
Same fire, same afternoon, 500 metres apart: the grove in its drainage burned at dNBR +0.562; the parking area on the dry ridge at +0.118. Nearly five times the severity. Tempting to call that terrain — but the two didn’t start equal. The grove was dense aspen, the ridge sparse sagebrush, and denser vegetation burns hotter more or less everywhere because it has more to lose.
So hold fuel constant, and compare the grove only against ground that was equally vegetated before the fire:
Controlled comparison · NBR pre-fire 0.40–0.55
| Group | Pixels | Mean dNBR |
|---|---|---|
| Grove ring | 147 | +0.876 |
| Same density elsewhere | 6,891 | +0.453 |
| Terrain-attributable | — | +0.405 |
The grove still burned harder than 72.3% of equally-fuelled ground. That residual can’t be fuel load — fuel load is what was controlled for. Both effects are real and they compound: the grove was the heaviest fuel on the hillside, standing in the feature that concentrated the fire into it.
Water collects in that drainage. Water grew the aspens. The aspens were the heaviest fuel on the hill, standing in the feature that funnelled the fire to them. Every reason the grove existed is a reason it burned.
Green-up: is the grove coming back?
NDVI responds to chlorophyll directly, so it is the index that moves first when aspen starts resprouting. But a raw grove curve is hard to read: vegetation senesces every autumn and greens up every spring whether or not it burned. An October decline could be fire or it could be October.
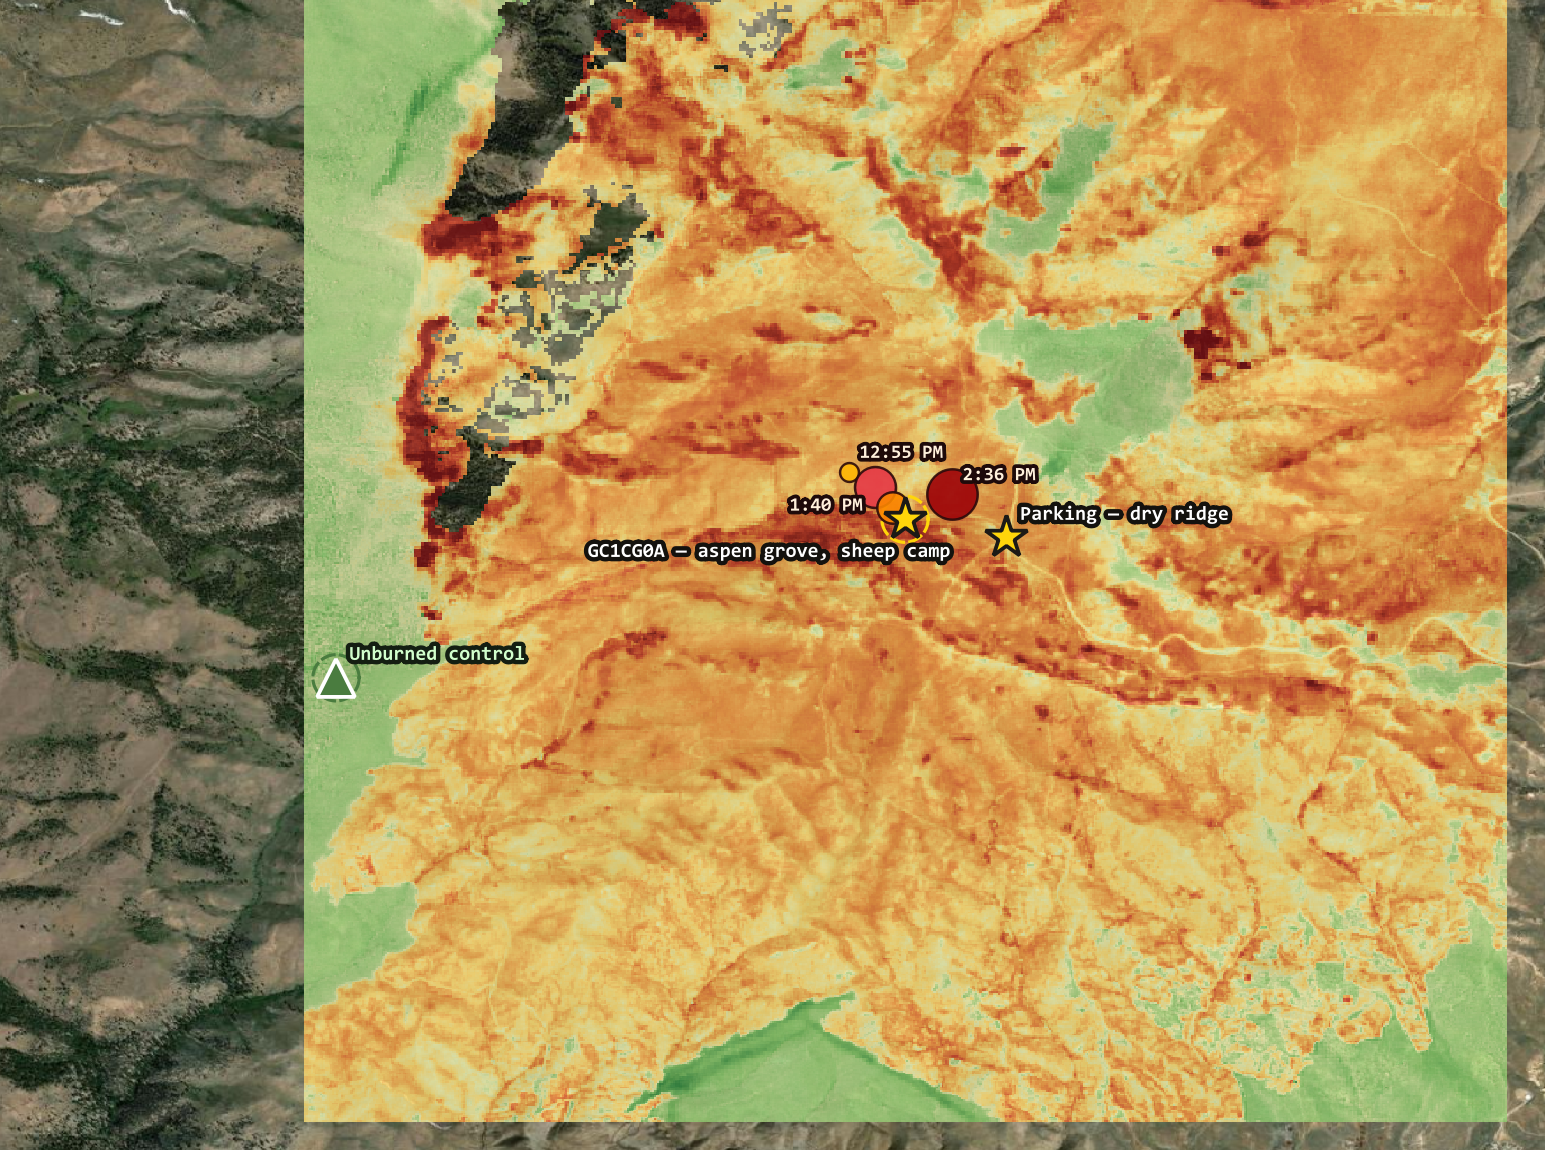
So every pass also samples an unburned control stand three kilometres west-southwest. Both stands get the same season, the same sun angle and the same atmosphere, so the difference between them isolates what the fire did. That difference, not the raw curve, is the number to watch.
The two sample sites
| Burned grove | Unburned control | |
|---|---|---|
| Latitude | 39.58475 N | 39.57551 N |
| Longitude | 119.94228 W | 119.97543 W |
| Sample radius | 150 m | 150 m |
| Pixels in ring | 697 | 700 |
| Mean dNBR | +0.671 | +0.001 |
| Pixels burned | 100% | 0% |
The control was chosen from the rasters, not by eye: pre-fire vegetation density in the grove’s band, dNBR below 0.08, between 600 m and 4 km away, and sitting in the densest cluster of 1,683 qualifying pixels rather than being one lucky pixel. It reads slightly denser than the grove ring on average, so it is used for change over time, not for absolute comparison of the two stands.
Burn signal and snow
NBR uses shortwave infrared, so it stays sensitive to char and bare soil long after green-up begins — it recovers more slowly than NDVI and tracks a different thing. NDSI is the snow index: once it goes positive and stays there, the optical assessment window is closed until spring melt-out.
Every pass
One row per Sentinel-2 scene, burned grove against unburned control. The Delta column is the one that matters: grove minus control, with season and atmosphere cancelled out. Rows in grey fell below 50% valid pixels after cloud, shadow and cirrus masking — smoke and cloud share the bright-green, dark-SWIR signature these indices are built on, so a contaminated scene can fake a signal. Those are recorded rather than dropped: a smoky scene is still data about smoke.
What this can never tell us
The cache is a steel ammo can — the best-case container for surviving a fast grass and brush fire. It is scorched almost certainly, and plausibly still there. The arborglyphs are a different story: they live in bark and cambium, thin living tissue, which is exactly what makes it carvable and exactly what gives it no defence against heat.
No satellite index can see bark. NDVI and NBR measure canopy and soil from 786 km up; the carvings are millimetres deep. That question needs someone standing in the grove — and UNR’s Center for Basque Studies, who catalogue Peavine’s arborglyphs, may hold documentation of what was there before August.
An ammo can is replaceable. A hundred years of a vanishing culture’s handwriting on a mountainside is not.
Related
Watching a Mountain Burn — the full write-up: how the burn severity was measured, why the first terrain conclusion was wrong, and what the recovery curve can and cannot tell us.
The Mountain You See Every Day — riding Peavine out of downtown Reno in the 1990s, and the aspen grove before any of this happened.
GC1CG0A · Basque Sheepherder: The High Camp — the cache, placed 2008, still listed.