Every once in a while a new geospatial tool shows up and you can tell immediately it has range.
That was my reaction to forge3d, a new Python package by Milos Popovic: a GPU-accelerated 3D terrain renderer built in Rust and shipped as prebuilt Python wheels. No Rust toolchain. No elaborate setup. Just pip install forge3d and go.
That is already a pretty compelling sentence. But what got me interested was not just the technical stack. It was the promise of a terrain workflow that felt fast, modern, and native to Python. So I did what I usually do when I find a new library that looks promising: I spun up an isolated pixi environment, opened a few notebooks, and started poking at it until I understood the shape of the thing.
And honestly, I was up and running much faster than I expected.
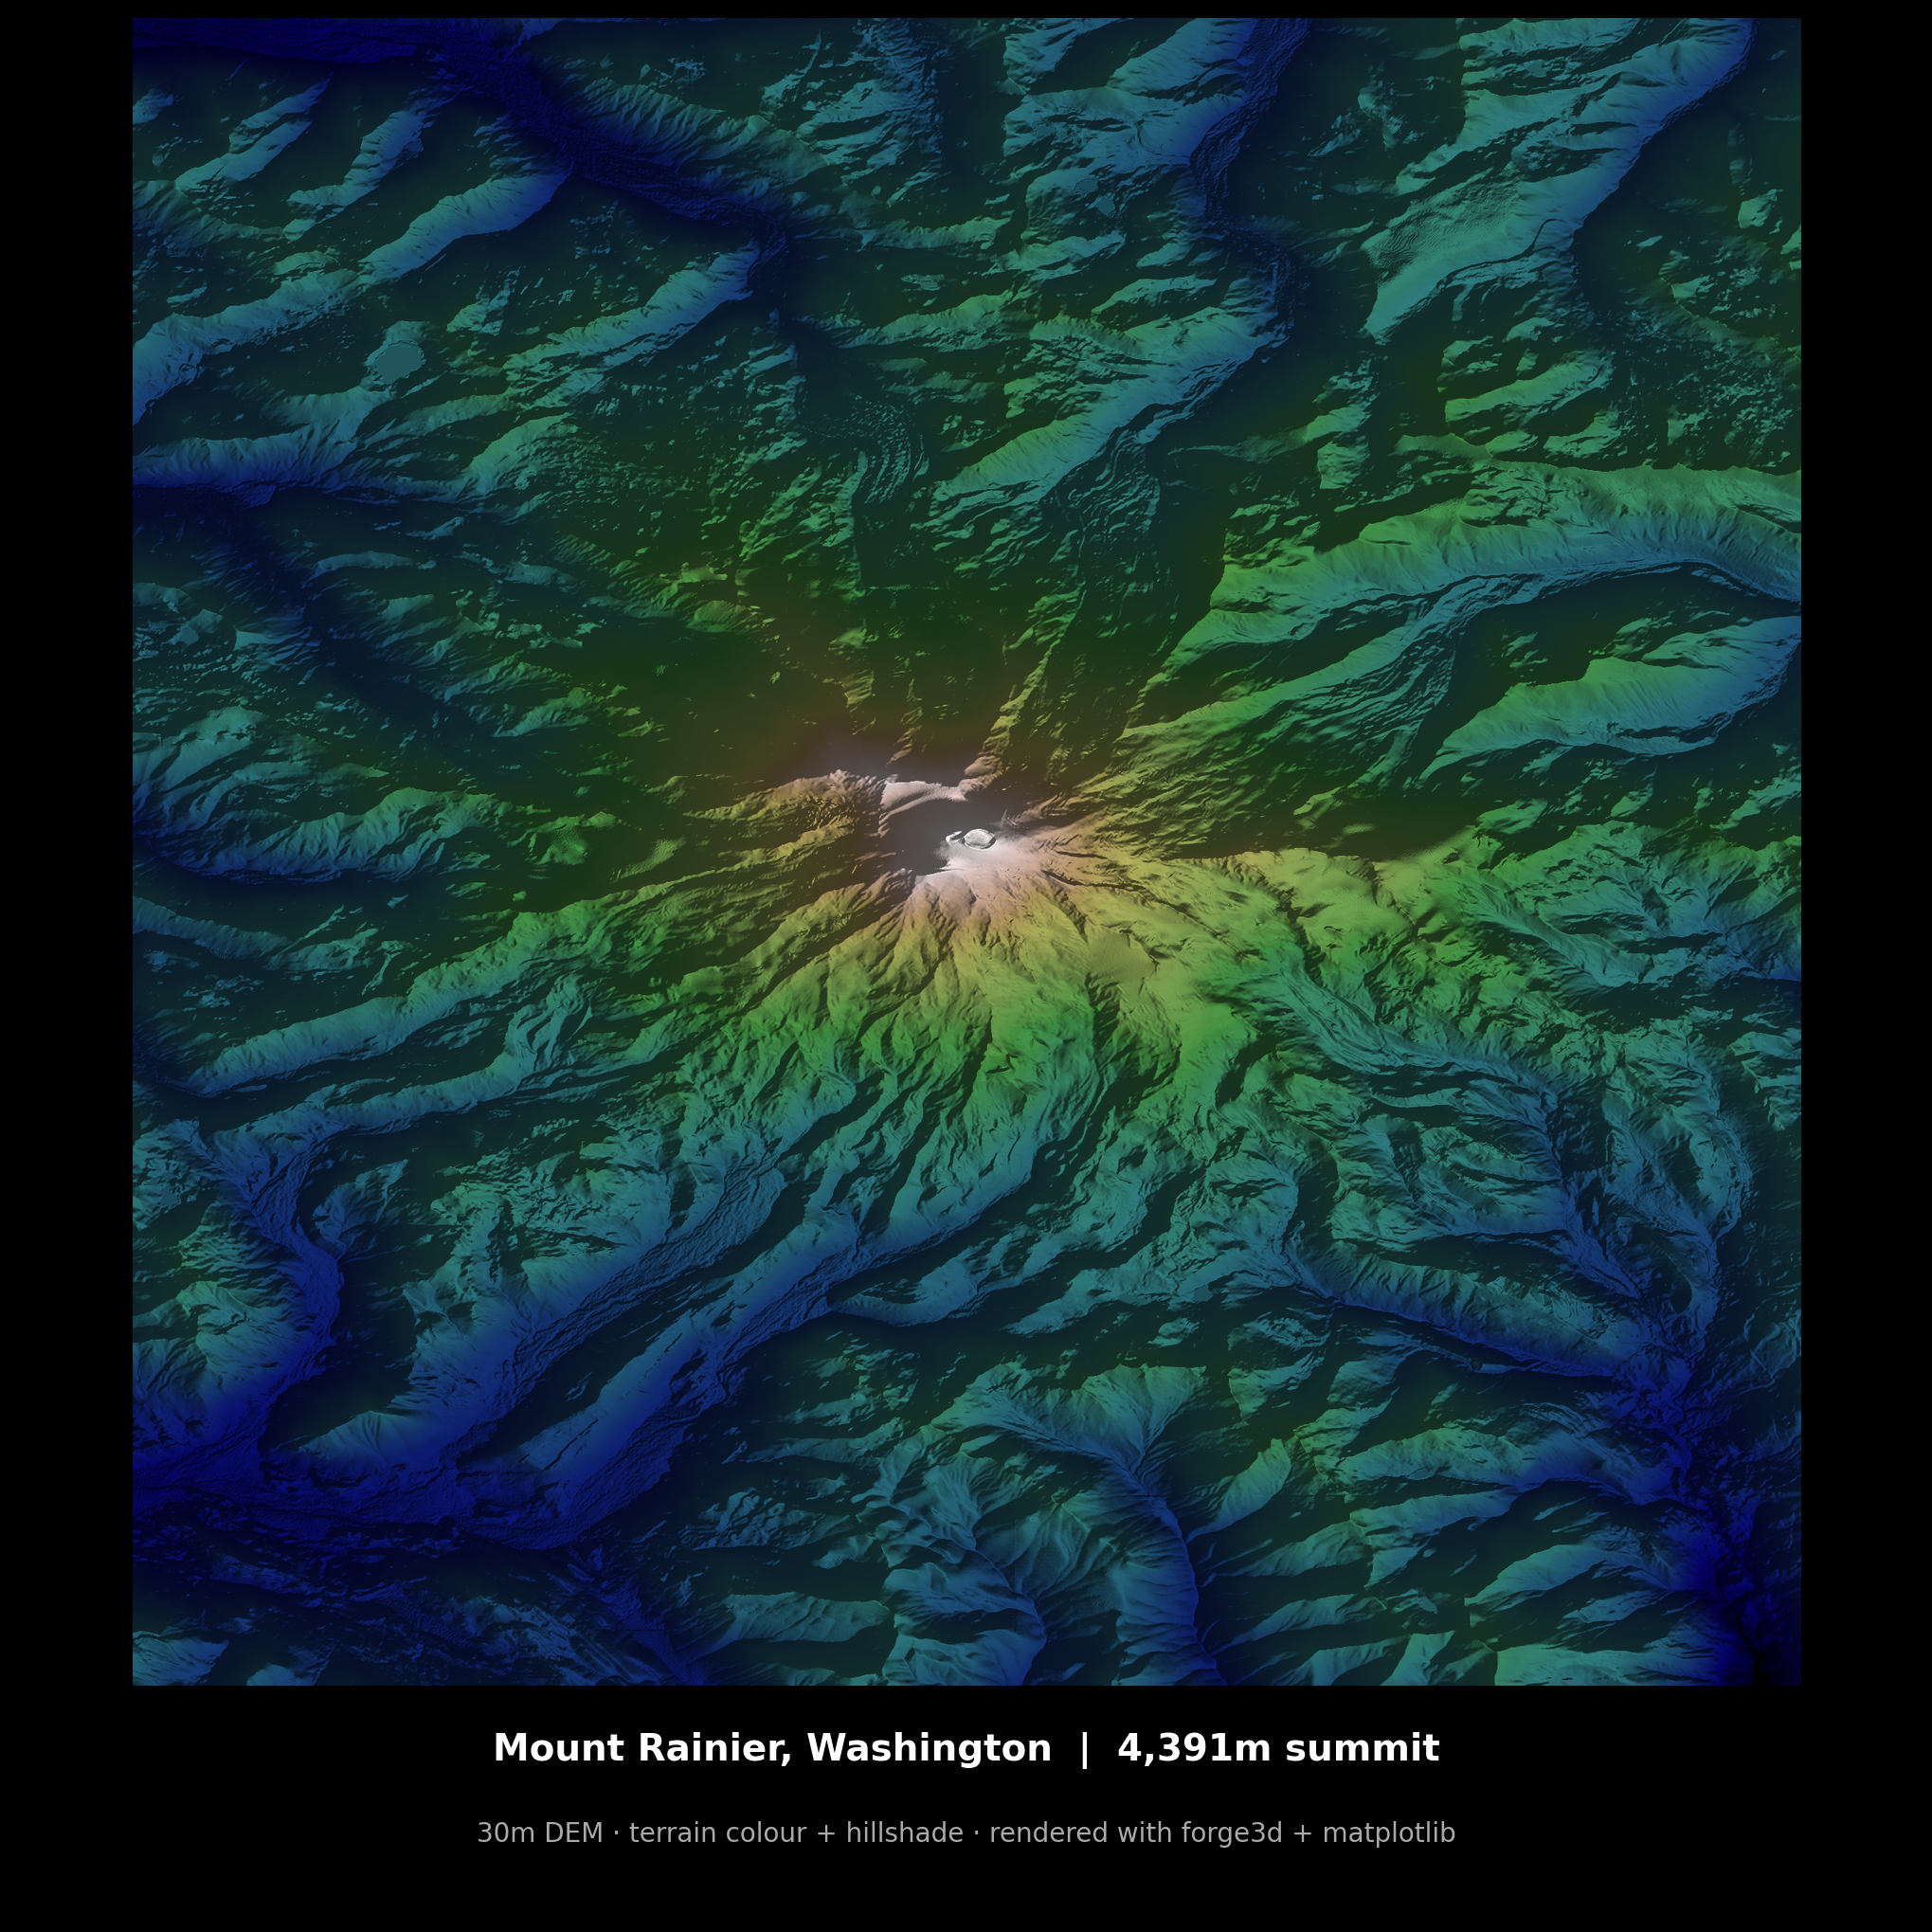
Mount Rainier, Washington · 4,391m summit · 30m DEM · terrain colour + hillshade · rendered with forge3d + matplotlib
Why I Tried It
Washington State has incredibly good open LiDAR data, so it felt like the obvious place to start. I mostly wanted to see what forge3d could do — especially with lighting, relief, and terrain shading — and one of the nicest surprises was how quickly I got to something usable.
I had been doing similar terrain work in R with Rayshader, and this felt much faster to get off the ground. Once I understood the basics, it really started to open up. The bottleneck was no longer the software. It was just my own imagination, plus however much great open LiDAR data I could find.
That is probably the best compliment I can give a new geospatial tool. It got out of the way quickly enough that I could start thinking about images instead of setup.
First Impressions
What stood out right away was that forge3d seems aimed at actual geospatial users, not just graphics people. Even early on, it already has the bones of a serious terrain workflow: DEM loading and terrain rendering, a large colormap catalog, CRS and reprojection support, Jupyter support, vector overlays, labels, and point cloud handling, and a Python API that is readable enough to learn from directly.
That last part matters more than people admit. A lot of geospatial libraries technically work, but make you fight them. This one feels like it wants you to get from raw elevation data to a render worth keeping with as little ceremony as possible. That is a very good instinct for a mapping library.
I Started With Mount St. Helens
I did not start by trying to reproduce the polished hero renders from the project page. I started with Mount St. Helens.
Partly because it is one of the most recognizable volcanic landscapes in the Pacific Northwest, and partly because it is just a great terrain subject. The crater, the blast zone, the radial drainage, the contrast between broad landforms and fine surface texture — it gives you a lot to work with very quickly.
It also made for a good test case because Washington's LiDAR data is good enough that you can really see the difference when you start pushing resolution. That led me to make three images: a 10-meter vs 1-meter resolution comparison, a standalone annotated terrain plate, and eventually a render of Crater Lake just to see how the workflow handled a completely different landform.
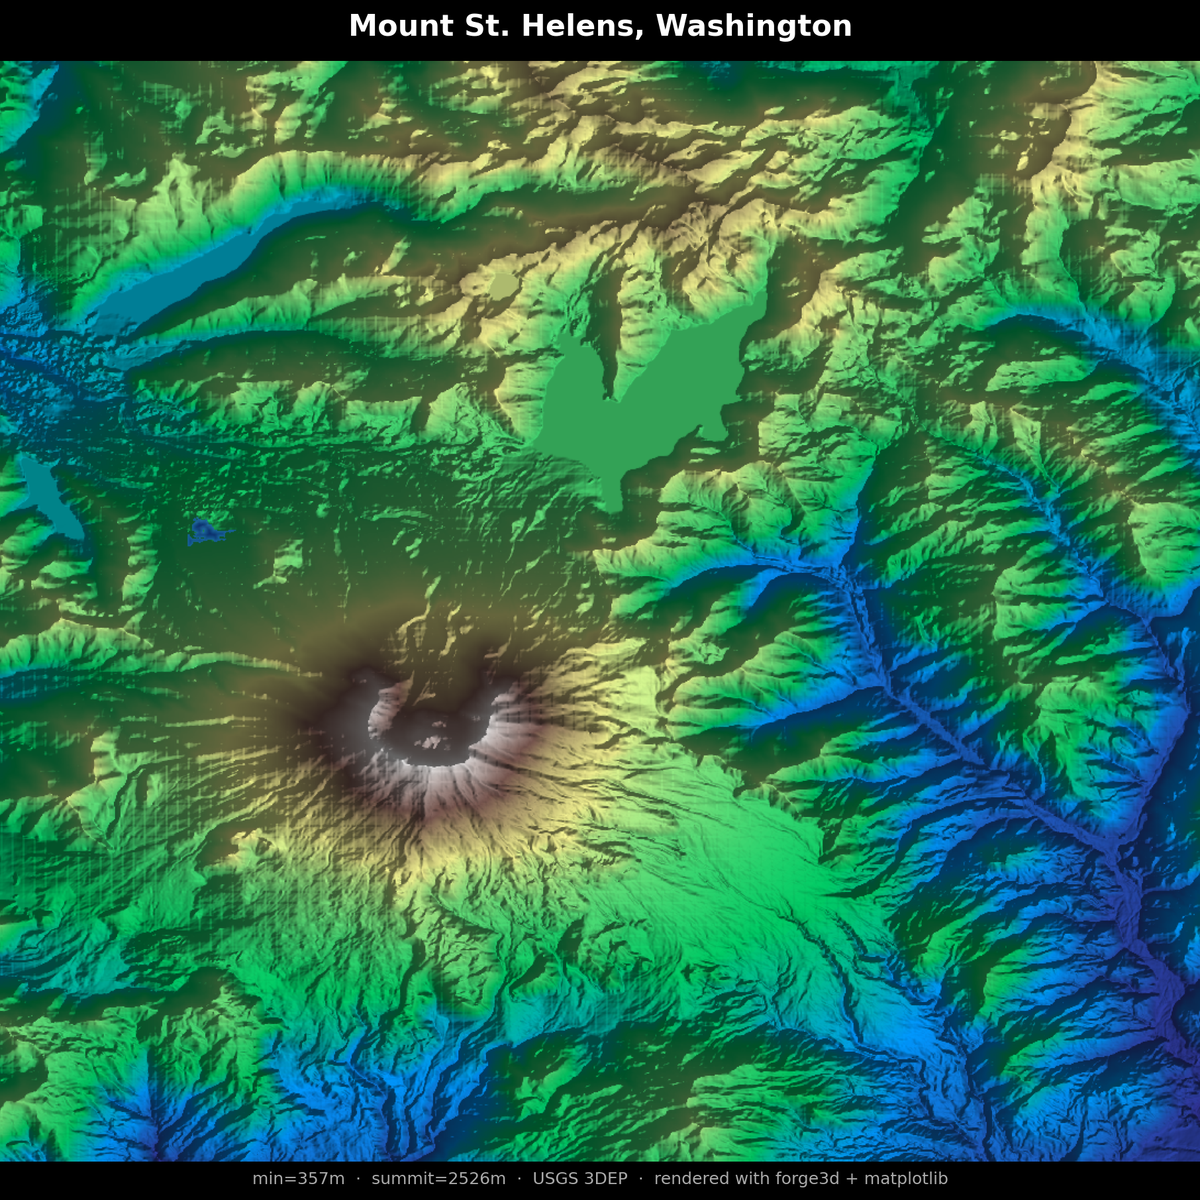
Mount St. Helens, Washington · summit 2,526m · USGS 3DEP 10m · rendered with forge3d + matplotlib · The crater and radial drainage make it a great first test subject.
The Resolution Comparison
This is where things got interesting. Same mountain, same color scale, same basic framing — but the jump from 10-meter USGS 3DEP data to 1-meter Washington DNR LiDAR changes the image completely. Gullies sharpen. Flow structure appears. Surface texture starts to read in a way that feels much more immediate.
That is where the package stops being "cool rendering tech" and starts becoming genuinely useful. The difference is not subtle. It is the difference between a terrain render that communicates landform and one that communicates geology.
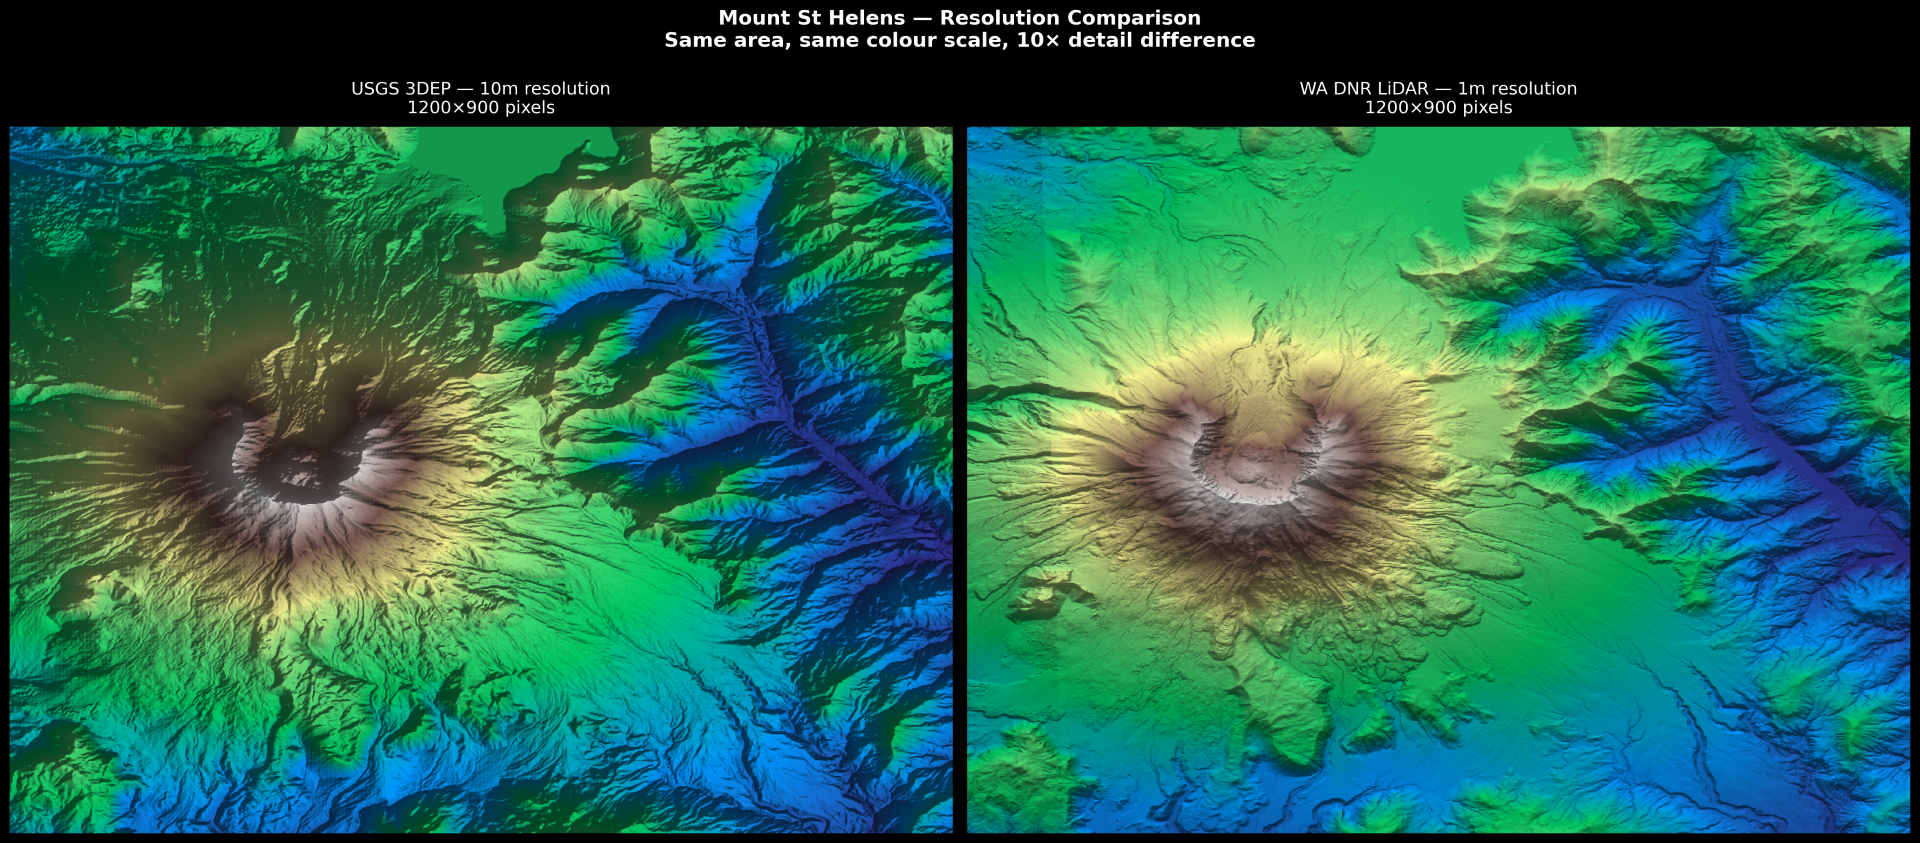
Same area · same colour scale · 10× difference in terrain detail · USGS 3DEP 10m (left) vs WA DNR LiDAR 1m (right) · Washington's open LiDAR data is where this workflow started to feel especially interesting.
Then Crater Lake
After St. Helens I wanted to test something structurally different — a caldera instead of a cone. Crater Lake is a great subject for exactly the same reasons St. Helens is: dramatic landform, clear story, and terrain that earns its elevation data.
The USGS 3DEP data handled the caldera rim and the deep lake basin cleanly. Wizard Island reads clearly in the render. The color scale at this elevation range does exactly what you want — it separates the water, the rim, and the surrounding plateau without any manual intervention.
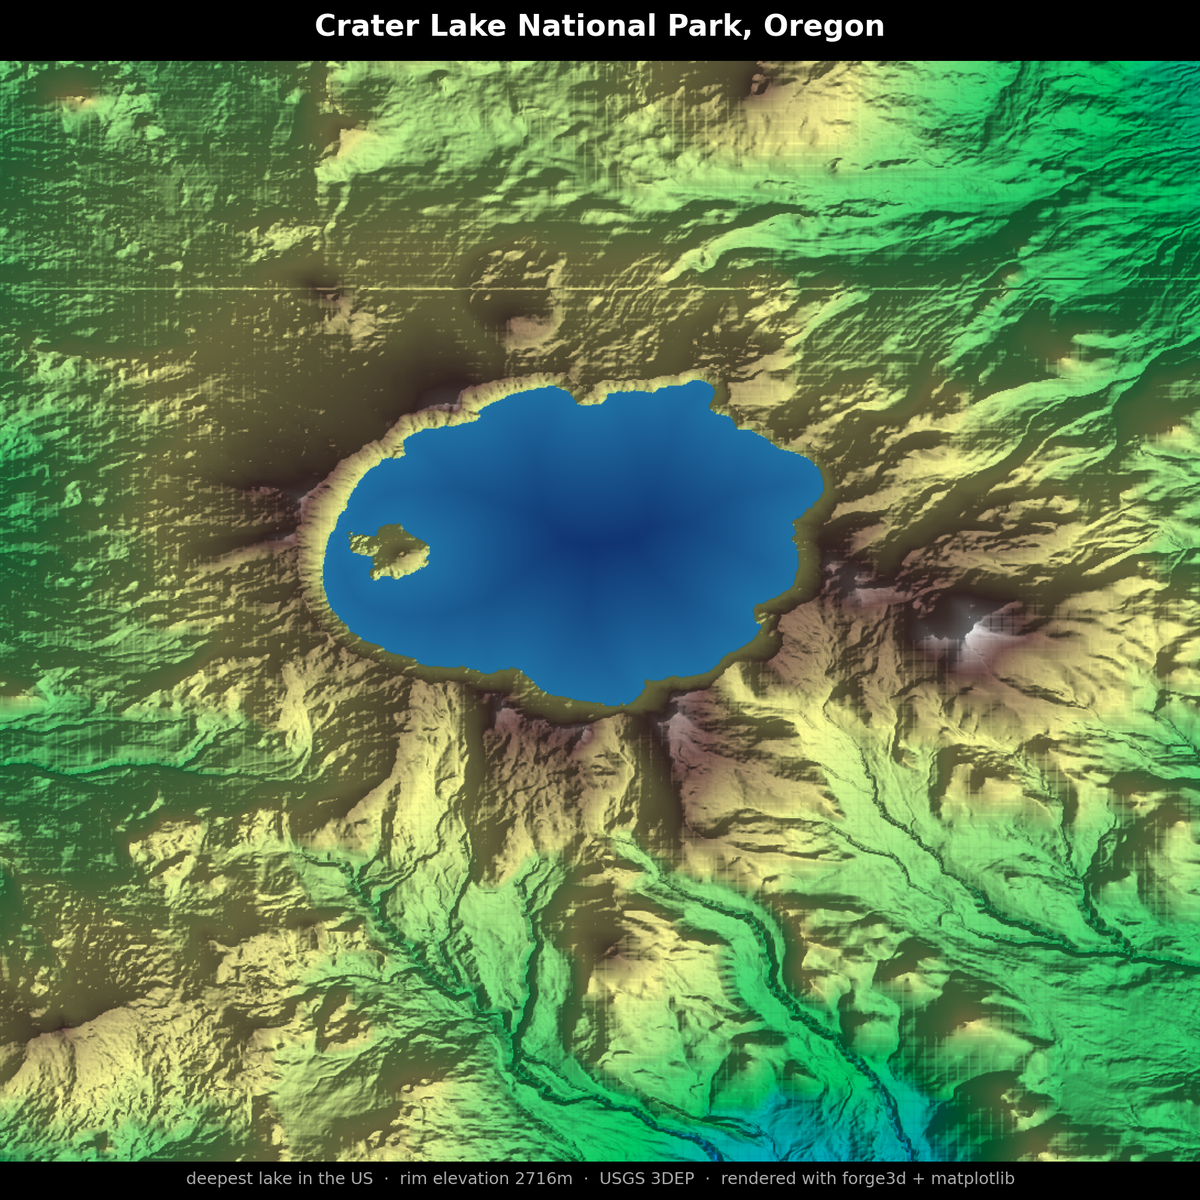
Crater Lake National Park, Oregon · deepest lake in the US · rim elevation 2,716m · USGS 3DEP · rendered with forge3d + matplotlib · Wizard Island reads clearly in the basin.
The Funny Part: My Favorite Output Wasn't Really About the GPU
The render I liked most was built with a pretty plain stack: forge3d for the terrain workflow, NumPy for the hillshade-style processing, and matplotlib for composition and output. No interactive viewer. No dramatic camera flythrough. No complicated rendering pipeline. Just Python, elevation, light, and composition.
That is not a criticism of forge3d. If anything, it is a point in its favor. Good tools do not force you into a single aesthetic or workflow. They give you leverage. forge3d seems built for high-end interactive and rendered output, but it also works as a very clean way into terrain data and scene-making even when the final image still passes through the Python tools you already trust.
What Stood Out
Packaging that makes experimentation easy. A Rust-backed rendering library shipped as Python wheels is just easier to say yes to. There is a big difference between "install this and start playing" and "clear your afternoon because your build chain might break." forge3d makes experimentation easy, which is exactly what a young library should do.
It feels designed for GIS people. This is not a graphics engine pretending to understand maps. The examples, terminology, and data model all suggest a project built by somebody who understands what geospatial users actually want to do: load terrain, manage coordinate systems, bring in overlays, place labels, and make strong images.
The source is readable. I like learning new libraries from the source when the docs are still evolving. forge3d is readable enough that this actually feels productive rather than intimidating. That matters a lot early in a project's life.
Why I Think It's Worth Watching
A lot of geospatial Python tools are either analytically strong and visually awkward, or visually strong and disconnected from everyday GIS workflows. forge3d looks like it wants to bridge that gap.
Terrain visualization is still more fragmented than it should be. You can do it in desktop GIS. You can do it in game engines. You can do it in custom graphics stacks. You can absolutely brute-force it in matplotlib. But there is still room for a tool that says: here is a modern renderer, here is a Python API, and here is a workflow that feels natural to geospatial people. That is a real niche.
And right now it feels like there is a lot of exciting geospatial tooling coming online in 2026. forge3d feels like part of that wave.
What I Want to Do Next
Now that I have the basic workflow working, I want to push it harder. The next thing on my list: find the highest-grade LiDAR I can get my hands on for Mount Rainier specifically and see what 1-meter resolution does to that summit terrain. The 30m DEM render above is already strong. What the WA DNR LiDAR does to it is going to be something else.
That is where I ended up with forge3d. Once I got the hang of it, I felt like I was mostly limited by my own ideas — and by the quality of the open data I could find. That is a very fun place to be. For a first pass, that is about as strong an endorsement as I can give. I installed it because I was curious. A few notebooks later, I had images I genuinely wanted to keep.
That is usually a sign.