I like maps and data
Live dashboards, lidar and the numbers behind them.
- 🔵 secchi: Lake Tahoe’s clarity, live
- 🌍 AFTERSHOCK: the ground, in real time
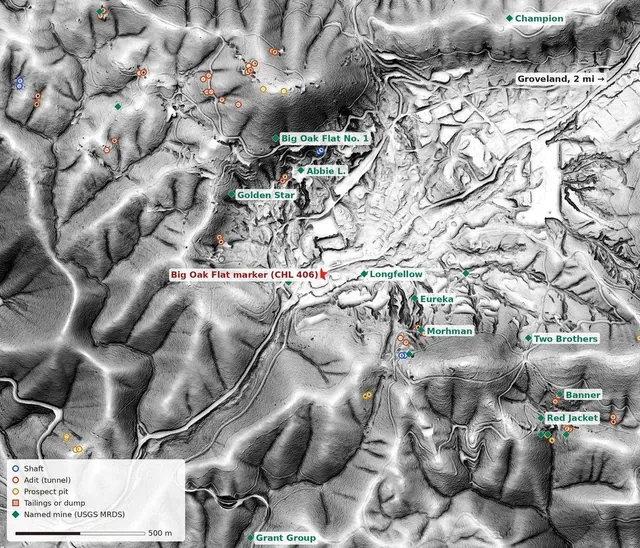
- ⛏️ Mother Lode: gold country in lidar
- 💧 Sierra Streamflow: every river, every morning
I like the outdoors and nature
Pikas, trout, glaciers and the places they live.
- 🪨 Pikas, Part 2: Washington’s Quiet Rockpiles
- 🐟 Two Creeks of Gold
- 🧊 The Athabasca Glacier, 1844 to 2100
- 🏔 Outside: racing, teams and the season
I’m here for the stories
Science writing, history and a few things I lived through.
- 🦠 The Rock Eaters
- 🗿 What Really Happened on Easter Island
- 🎃 Boo Before You’re Ready
- 🗺️ A Draught of the South Land
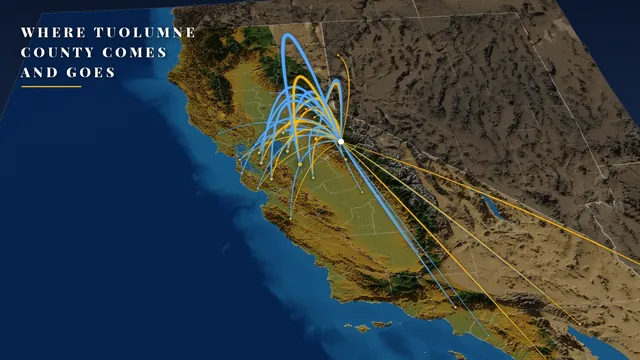 Nov 7, 2026🧭 Where Tuolumne County Comes and GoesWhere people leaving Tuolumne County go, and where newcomers come from, as gold and blue arcs rising out of Sonora over a 3D California rendered in forge3d, plus an orbit film. Stanislaus is the biggest flow both ways, the Bay Area sends far more people up the hill than it gets back, and Florida gets about 23 people a year.
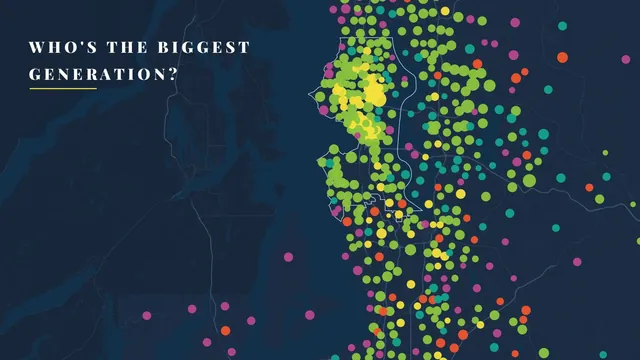 Nov 2, 2026👥 Who’s the Biggest Generation Where You Live?Inspired by Jake Steinberg’s map in The Twin Cities in 50 Maps: every census tract in the Seattle metro and in Tuolumne County, California, as a dot colored by its largest generation. Millennials lead 408 of 863 Seattle-area tracts, Gen Z fills the University of Washington, Gen Alpha gathers in the Pierce County suburbs, and Boomers lead 15 of Tuolumne’s 18 tracts, where one of the exceptions is a state prison.
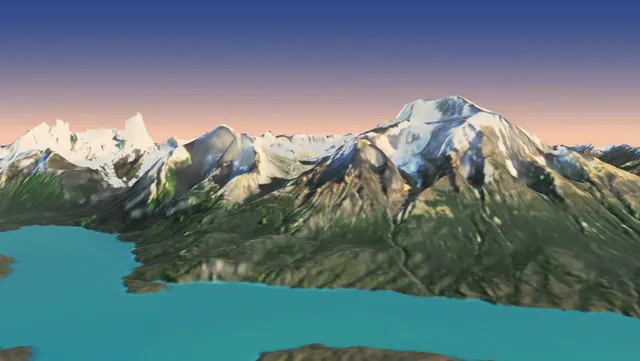 Nov 2, 2026🏔️ Torres del Paine, Twice: A Sunrise Flight and a Patagonia in MiniatureTorres del Paine two ways: a sunrise flight from Lago Grey and the Grey Glacier over the Cuernos to the Torres, rendered with forge3d from Copernicus elevation and a clear Sentinel-2 pass, and a spin-it-yourself diorama with icebergs, condors, hikers on the W and a Patagonian wind button, plus sidebars on the glacier, the Cuernos' dark tops, the wind, the pumas, the W and the O, and the fires, with podcasts and papers to go deeper.
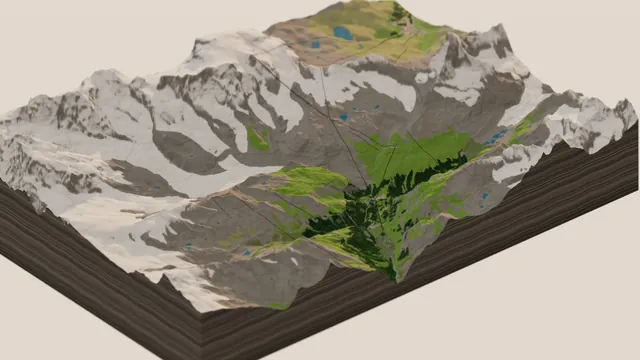 Oct 30, 2026🐄 Zermatt in Miniature: The Matterhorn, the Gondolas and the CowsGoing big in Switzerland: Zermatt and the Matterhorn from swisstopo's free 2 m elevation data and OpenStreetMap, with 46 lifts on their cables, the Gornergrat cog railway, 2,620 chalets with red geraniums, alphorn players, cows dressed for the Alpabzug, and a switch to ski season, plus sidebars on the Matterhorn's African summit, the 1865 first ascent, the cog railway and the Eringer queens.
Weather & Water
Storms, smoke, floods, snowpack, tides and the rivers of the Sierra and Northwest.
- The Handoff: Teaching SIERRA-FLOW a New Language
- The Gap That Isn’t: Who Answers a Wildfire in Eastern Oregon
Volcanoes, Fossils & Ruins
Kīlauea, Rainier, ichthyosaurs, mammoths, Chaco Canyon and the mounds.
- Torres del Paine, Twice: A Sunrise Flight and a Patagonia in Miniature
- Zermatt in Miniature: The Matterhorn, the Gondolas and the Cows
Maps & Flyovers
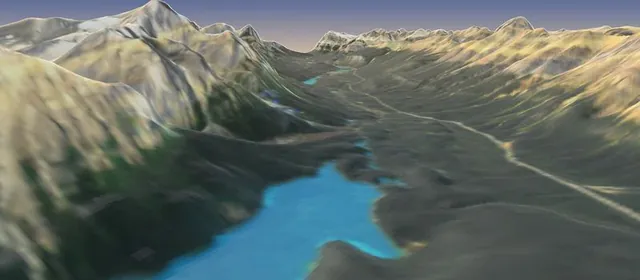
forge3d flights, lidar and cartography, from Yosemite to the Icefields Parkway.
All 19 entries →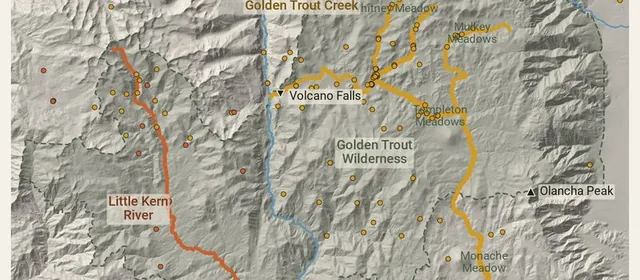
Science & Nature
Pikas, golden trout, Lahontan fish and Easter Island, told with maps and data.
All 11 entries →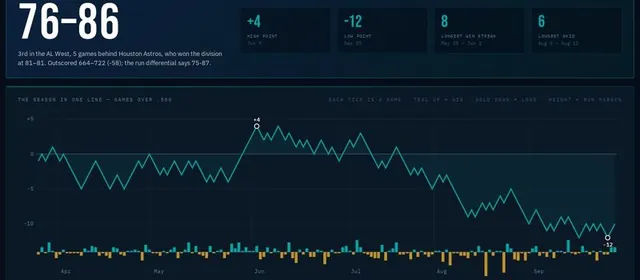
Cycling, Sports & Training
Grand Tour stage trackers, the Mariners, triathlon fueling and the rest of the sporting life.
- The Dakar in Miniature: The Algarve, the Atlas and the Sahara
- 76–86: The Mariners Season, and What My Dashboard Missed
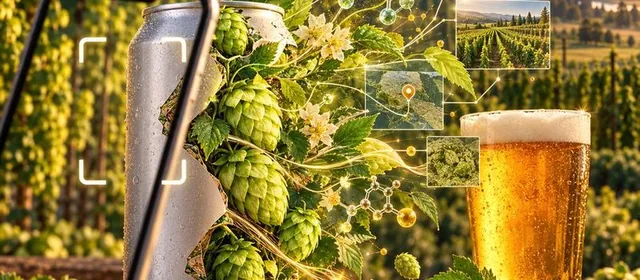
Beer & Builds
HopLove, a searchable cookbook, a trade journal for the investment club, and other things I've made.
All 6 entries →🌦 Weather & Water
Weather pipelines, snowpack, streamflow and lakes, from the Sierra to the Cascades.Meteorology →Hydrology →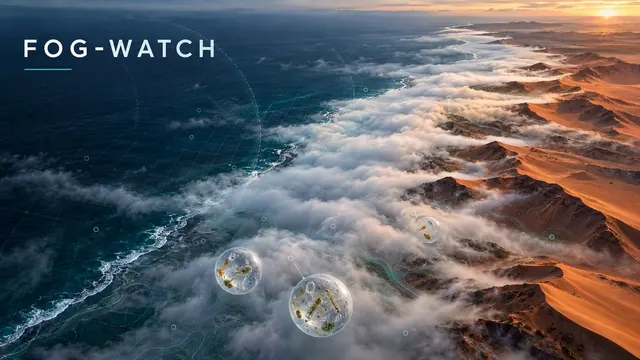
Meteorology · ERA5 · Fog Coasts
🌫️ FOG-WATCH — Where the Fog Lives
A fog climatology for the world’s great fog coasts: the Namib, the Atacama and San Francisco. Ten years of hourly ERA5 turned into a fog-blanket map with a month slider, an inland transect past Gobabeb, and heatmaps of exactly when the fog rolls in.
View the maps →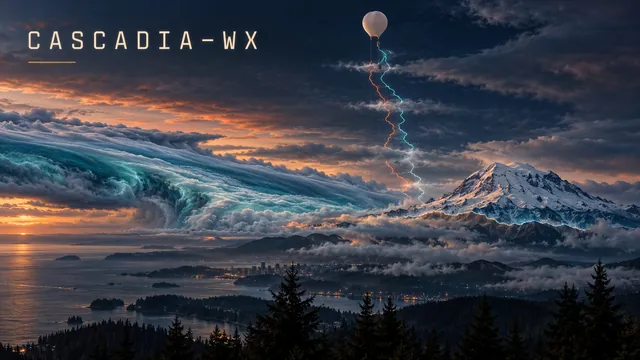
Meteorology · FORTRAN · Weather Balloons
🎈 CASCADIA-WX — Reading the Balloons
The Northwest’s four weather balloons, read twice a day in GFortran: freezing level, snow level and atmospheric rivers, each against 30 years of balloons. Amber-phosphor page, green-bar printout.
View dashboard →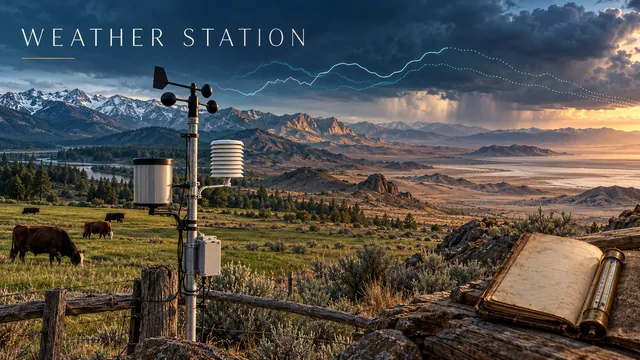
Meteorology · 4 Stations · NWS + ACIS + Open-Meteo
🌡️ Weather Station — "We Got Cows"
A NOAA-ops-center-style dashboard monitoring four Western stations — Lakewood, Sonora, Reno, and Death Valley — read live from National Weather Service stations every 5 minutes. Measured-then-forecast charts, the forecaster’s notes, records back to 1893, NWS alerts. Storm-chaser instrument panel, built for $0.
View live dashboard →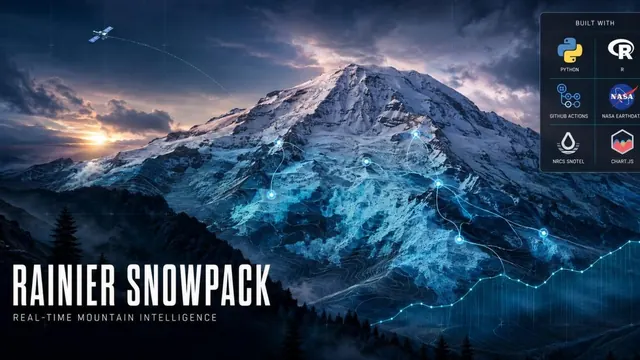
Snowpack · SNOTEL · NASA MODIS · Webcams
❄️ STORM CHASER — Rainier Snowpack
Real-time Mt. Rainier snowpack intelligence — 7 SNOTEL ground stations, NASA MODIS satellite snow cover with 14-day cloud fallback, and 6 live NPS webcams. Nine panels, hourly, forever. "You don't chase the mountain. The mountain chases you."
View live dashboard →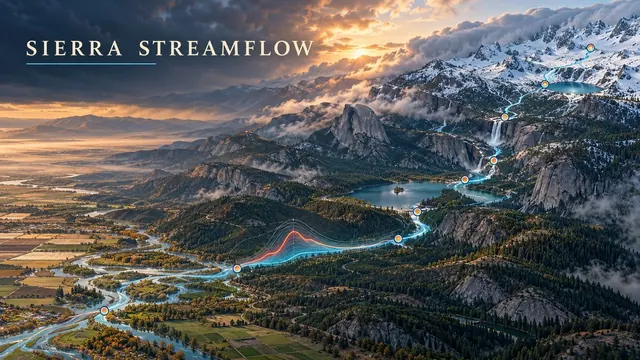
Hydrology · USGS · Sierra Nevada
💧 Sierra Streamflow Monitor
Eight USGS gages across the Tuolumne, Merced, Stanislaus, and Big Creek watersheds — live flow with historical spaghetti charts on a Leaflet map.
View dashboard →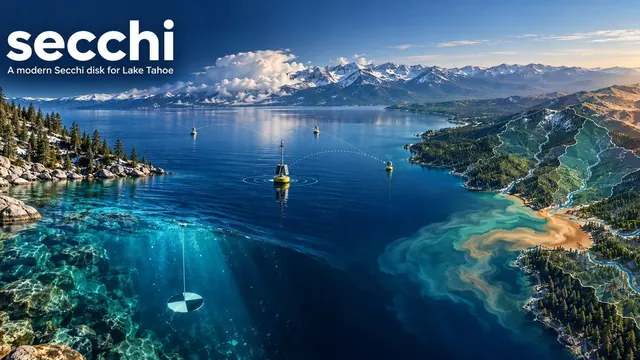
Limnology · Lake Tahoe · TEON · 15-min cadence
🔵 secchi — a modern Secchi disk
Live water-clarity readings from the Tahoe Environmental Observatory Network — three YSI EXO sondes around the lake sampled every fifteen minutes, cross-checked against USGS gauges on the tributaries. Wildfire smoke deposition overlay and a chlorophyll-based Secchi nowcast are next.
View live dashboard →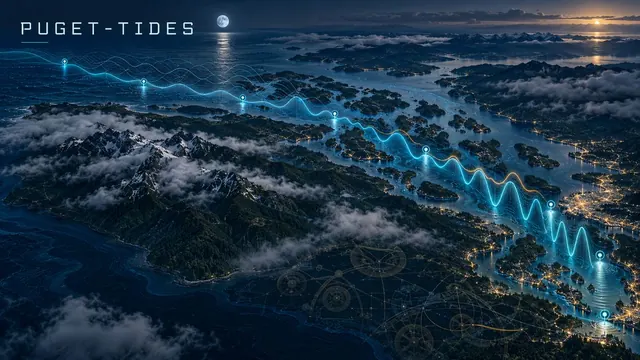
Tides · FORTRAN · NOAA · Puget Sound
🌊 PUGET-TIDES — in FORTRAN
Eight NOAA tide gauges from Neah Bay to Tacoma. FORTRAN predicts the tide from its 37 harmonic constituents and checks itself against NOAA’s tables every six hours, then measures the surge and finds the king tides and daylight minus tides of the year ahead.
View dashboard →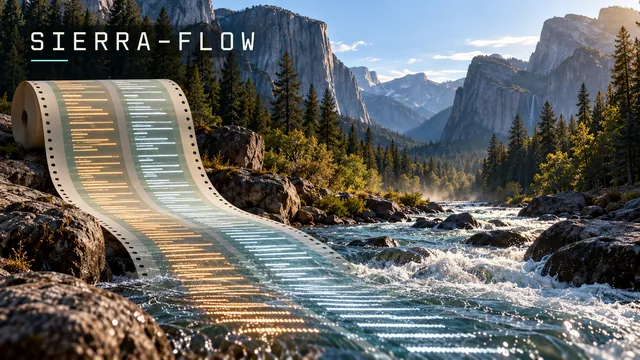
Hydrology · COBOL · Retro
🖥️ SIERRA-FLOW — in COBOL
Eight Sierra rivers run through a GnuCOBOL batch job every morning and checked against 30 years of normal for the date, which COBOL builds itself. The report prints on green-bar paper; the program is on punch cards. Yes, COBOL.
View dashboard →🌋 Volcanoes & Earth
Live eruptions, lahar hazards, earthquakes, and gold country in bare-earth lidar.Volcanology →Geology →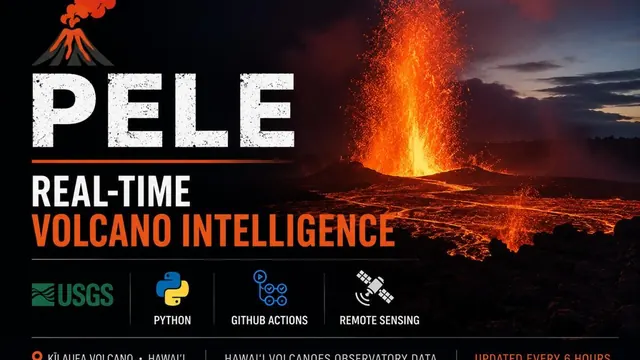
Volcanology · Kīlauea · USGS HVO
🌋 PELE — Hawaiʻi Volcanoes
Real-time Kīlauea eruption tracker — lava-lake activity, SO₂ emissions, and episodic fountaining via USGS Hawaiian Volcano Observatory feeds. Updated every 6 hours.
View dashboard →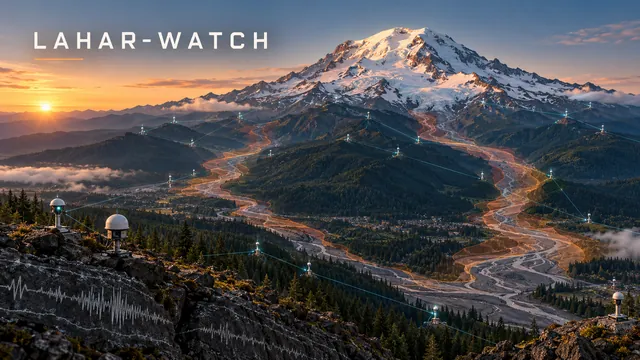
Hazard · Volcano · USGS · NOAA
🌋 LAHAR-WATCH — Flank Hazard
The network that watches Mount Rainier for lahars, live: every seismometer and infrasound sensor and whether it’s reporting, the USGS alert level, earthquakes against 25 years of normal, and the lahar rivers against flood stage.
View dashboard →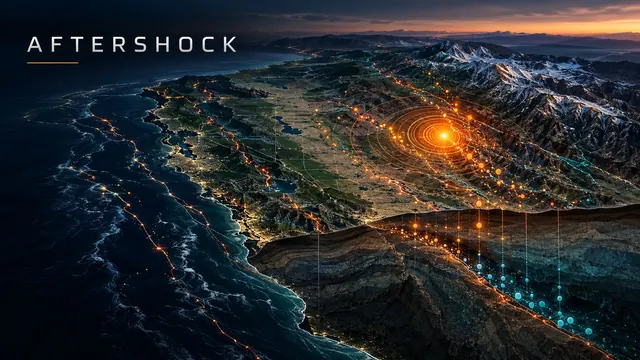
Seismology · USGS FDSN · Live
🌍 AFTERSHOCK — Real-Time Quakes
Live earthquakes for the US and the world — pick any state or country, see it against ten years of normal, and follow aftershock sequences as they decay.
View dashboard →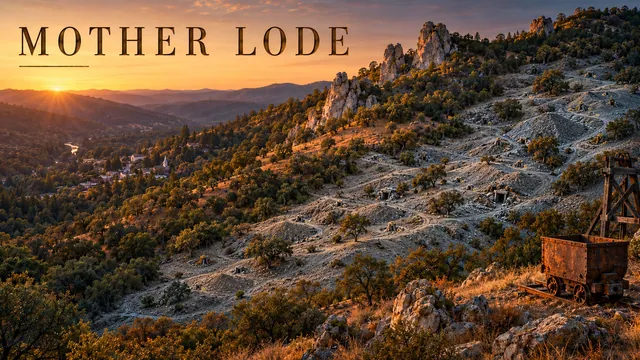
Geology · Lidar · USGS · Tuolumne County
⛏️ Mother Lode — Gold Country in Lidar
The gold belt where I grew up, with the trees peeled away: five mining places in bare-earth lidar, from Columbia’s limestone pinnacles to the Harvard pit at Jamestown, and every USGS mine feature in Tuolumne County — 1,040 adits, shafts and prospect pits.
Open the map →🏺 Deep Time
Fossil-finding models, ancient places in lidar, and the sky the builders watched.Paleontology →Archaeology →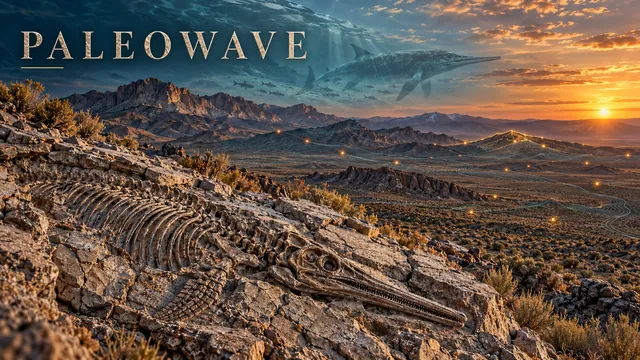
Machine Learning · Paleontology · Nevada
🌊 PaleoWave — Fossil Finder
A terrain model of where central Nevada's Triassic ichthyosaurs have been found, and fifty places it says to go and look. Rechecked in October 2026: it knows 18 places, shows its homework, and checks the Paleobiology Database every week.
Open the page →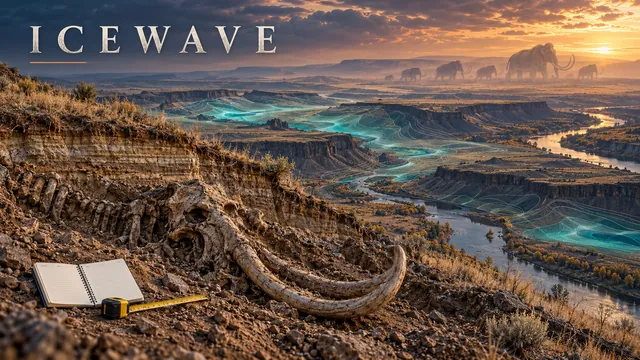
Machine Learning · Ice Age · PNW
🦣 IceWave — Rechecked
A model of where mammoths and other Ice Age animals might be buried across five states. Rechecked in October 2026: its top targets were rivers and reservoirs, and its "validation" at a real mammoth dig was 69 km off. The page shows how, and what holds.
Open the page →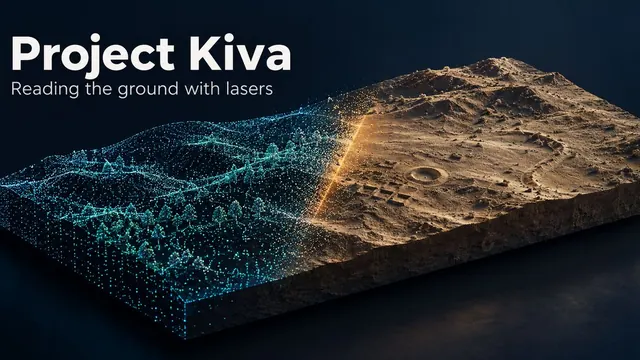
Lidar · Remote Sensing · Atlas
🏺 Project Kiva — Ruins in Bare Earth
Twelve archaeological places in bare-earth lidar, from Chaco Canyon to Cahokia and the Wisconsin effigy mounds. Peel back the aerial photo, switch relief views, and turn each site in 3D.
Open the atlas →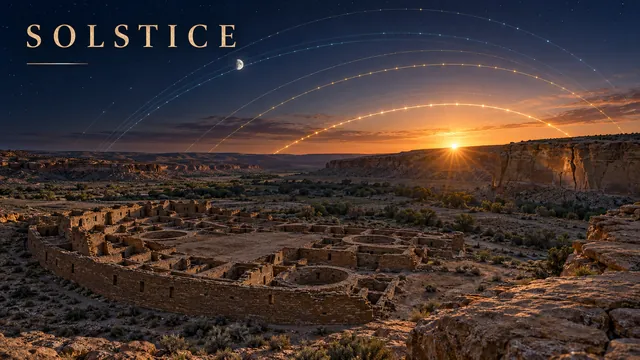
Archaeoastronomy · Chaco Canyon · Live
☀️ SOLSTICE — The Sky Over Chaco
The live Sun and Moon over Chaco, each great house’s real skyline with every sunrise of the year, and a forge3d flight down the canyon at solstice dawn.
View live →🗺 Geospatial
Lidar, satellites and maps: forests, cargo yards, mountain rescues and flyovers.Geospatial →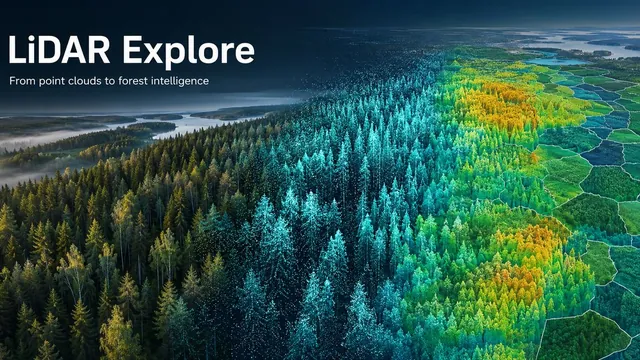
Lidar · PDAL · Forestry
🌲 LiDAR Explore — Finding the Trees
Airborne lidar end to end: PDAL pipelines, canopy height models and single-tree detection, from a synthetic Finnish forest to 1,840 real stands checked against Finland’s national inventory.
Open the project →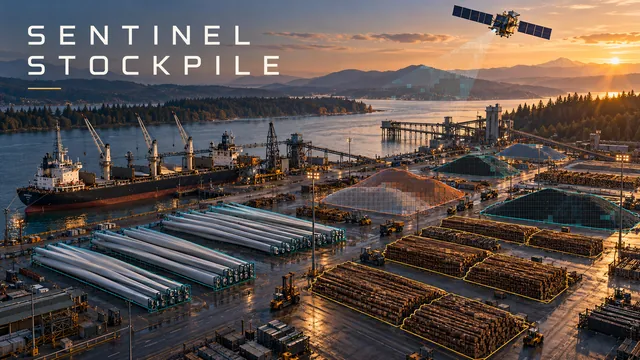
Remote Sensing · Sentinel-2 · Python
🛰️ Sentinel Stockpile — Cargo From Space
Eight cargo yards on the Columbia, Puget Sound and Grays Harbor, measured from free Sentinel-2 imagery twice a week, from wind-turbine blades to log decks.
View dashboard →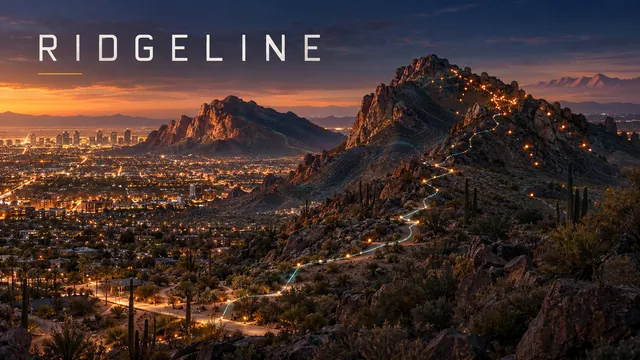
Search & Rescue · Geocoding · Phoenix
⛰️ RIDGELINE — Where the Trail Runs Out
Mountain rescues at the edge of the city: 1,489 Phoenix rescues put back on the map once the addresses were fixed, with Scottsdale and Boulder alongside, and a look at Phoenix’s summer heat closures.
View dashboard →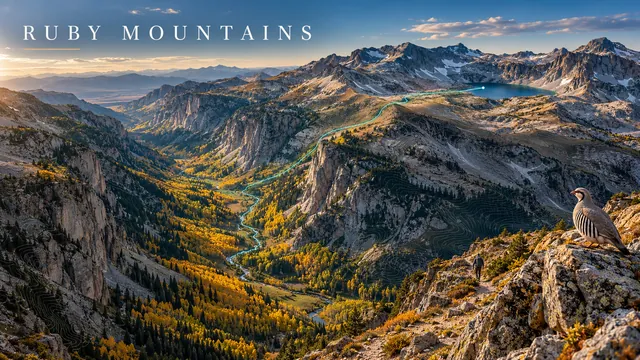
forge3d · 1 m Lidar · Nevada
💎 Into the Rubies — A Lidar Flyover
A two-and-a-half-minute forge3d flight up Lamoille Canyon in Nevada’s Ruby Mountains, over Liberty Pass to Liberty Lake on the Ruby Crest Trail.
Watch the flight →🌿 Ecology
Mountain lakes, kangaroo rats, cypress domes and pikas, read from satellites, lidar and citizen science.Ecology →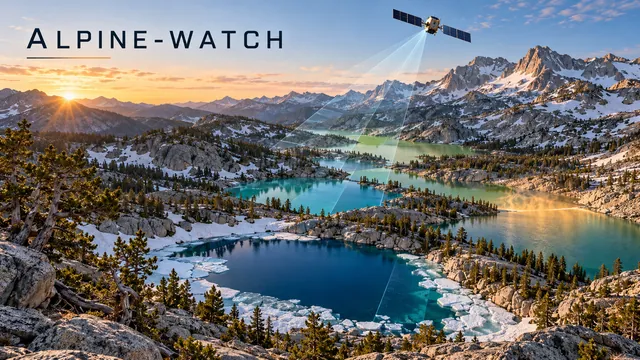
Sentinel-2 · Landsat · Python
🏔️ ALPINE-WATCH — Mountain Lakes From Space
17 Sierra and Cascade lakes watched from space: Forel-Ule colour, a chlorophyll index, ice-out and summer temperature, each against its own past.
View dashboard →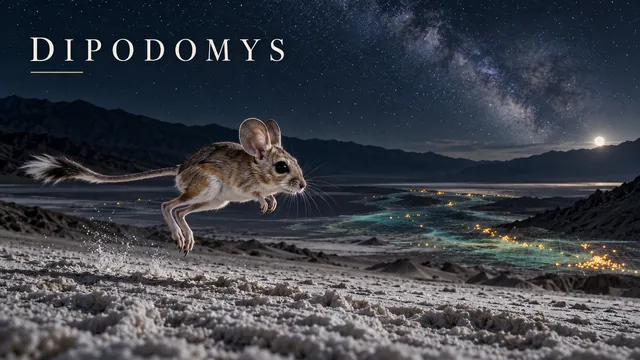
Ecology · iNaturalist · Leaflet
🐾 DIPODOMYS — Death Valley Kangaroo Rats
Live iNaturalist data on two kangaroo rat species sharing one valley: citizen science and habitat partitioning in the hottest place on Earth.
Live map →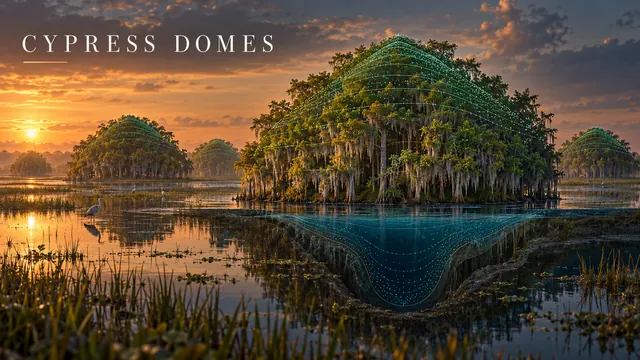
Lidar · USGS · Florida
🌳 Cypress Domes — Water in the Shape of a Forest
Cypress domes grow tallest where the water stands longest. Streaming USGS lidar a square kilometre at a time turned up 166 dome candidates in Big Cypress, and 150 rise toward the middle.
View the map →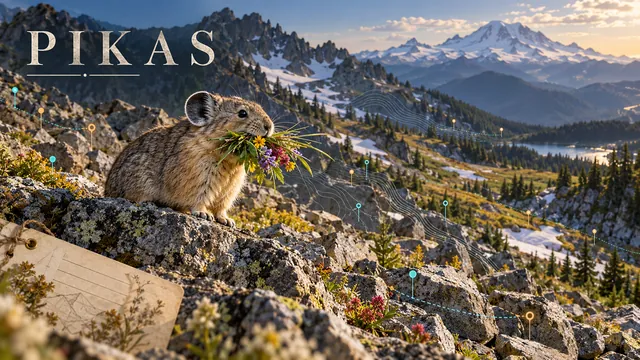
Ecology · GBIF · Museum Records
🪨 Pikas — Washington’s Quiet Rockpiles
Old museum pika sites checked against every modern record. Most of Washington’s “missing” sites aren’t missing at all, and here are the 10 real places worth a hike.
Read it, with the map →🔭 More
Sport analytics, beer, fueling for a race, and the neighborhood pantries.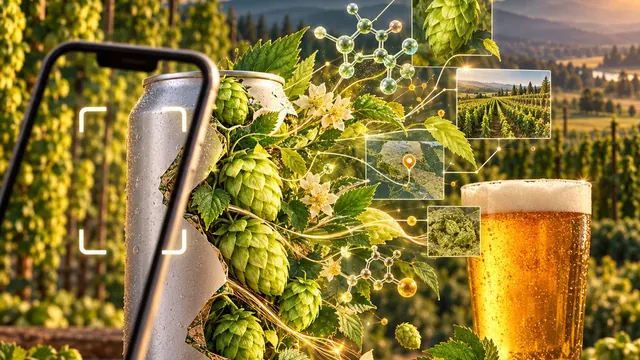
Open Data · Hops · USDA NASS · Pacific NW
🍺 HopLove — know your hops
An open hop database that shows its sources: 232 varieties, every number cited to the breeder, grower or merchant who published it, disagreements left visible. Washington and Oregon acreage by variety from USDA, and What's in the Can — 2,000+ beers from 32 breweries, Bellingham to Corvallis, hop by hop. Or snap a can and it reads the hops for you.
Open HopLove →
Baseball · Mariners · MLB Stats API
⚾ EDGAR — Mariners Analytics
Early Data & Game Analytics Report — the 2026 Mariners in one line, the AL West race, FIP and pitch arsenals from Baseball Savant, and the Rainiers. Rebuilt nightly by GitHub Actions from MLB StatsAPI and Savant.
View dashboard →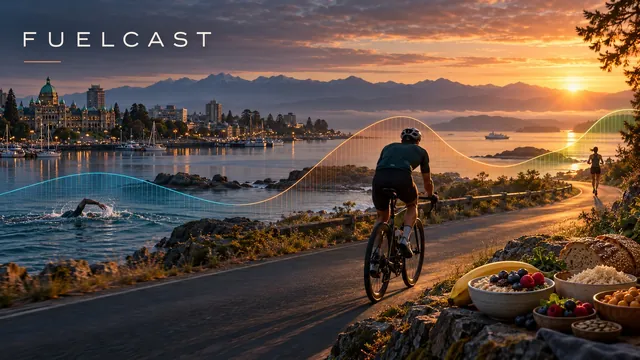
Training · Garmin · Nutrition
⛽ FuelCast — Fueling the Build
A fueling engine for the build to Ironman 70.3 Victoria: it reads energy use, body composition and training load from Garmin and sets each day’s carbs, protein and fat.
Open FuelCast →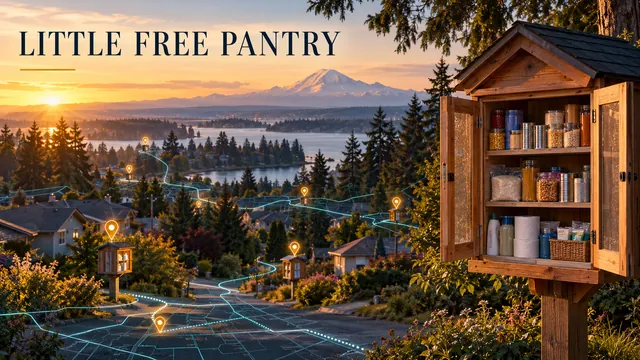
Community GIS · Civic Tech · Leaflet
🏠 Little Free Pantry — Food Access in Lakewood
An interactive map of the Lakewood Rotary’s pantry network: seven pantries with 24/7, no-barrier food access across Lakewood.
Live map →
Everything here is free to read. If something stuck with you, you're always welcome to buy me a beer🍺 — most likely spent on something strange and wonderful from the tap log at Peaks & Pints here in Tacoma. No pressure, and thank you for reading.