Every year, the Pacific Northwest lumber supply chain does the same thing. Mills cut timber all summer. Logs pile up at export terminals along the Columbia River. Ships carry them to Asia. Then winter comes, logging roads close, and the yards go quiet. We know this because economists track it, because industry reports document it, and — as of this project — because we watched it happen from 500 miles up.
Sentinel Stockpile is a commodity intelligence pipeline built on free ESA satellite imagery and Microsoft Planetary Computer. It monitors industrial stockpile levels at fixed locations over time — watching the lumber accumulate and deplete at the Port of Longview, Washington, the largest log export terminal on the Columbia River, scene by scene, across an entire year.
The Time Series
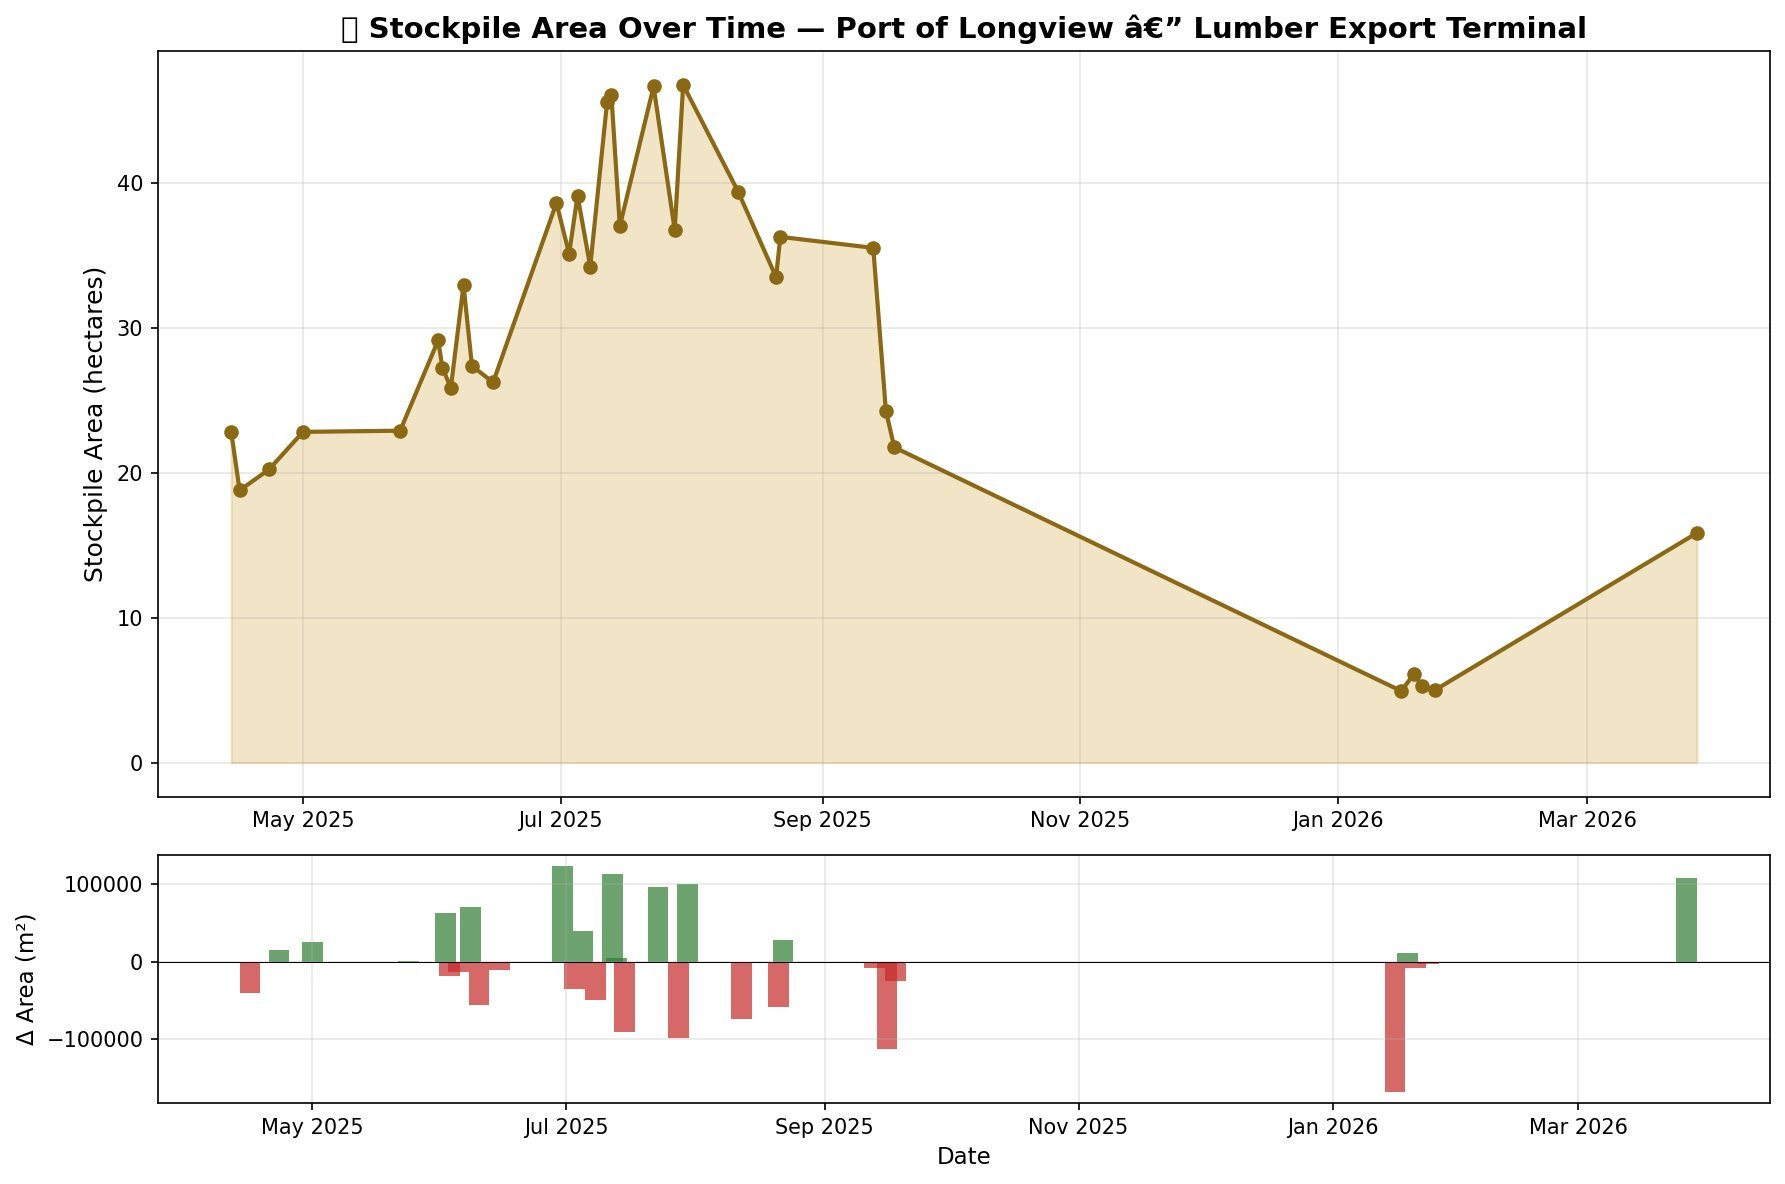
Port of Longview · 12-month stockpile area · April 2025 – April 2026. Each dot is a Sentinel-2 scene. The seasonal pulse of the Pacific Northwest lumber industry, measured in hectares.
That chart is 12 months of lumber stockpile area at Port of Longview. The signal is unmistakable — a classic seasonal cycle driven by the rhythm of Cascades timber harvest, Columbia River export logistics, and Asian construction markets.
| Season | Area | What's Happening |
|---|---|---|
| Spring (Apr–May) | ~20 ha | Yards sitting at annual low. Mills spinning up after winter. Logging trucks starting to roll as mountain roads dry out. |
| Summer (Jun–Jul) | 47 ha peak | Peak harvest. Cascades timber sales in full swing. Lumber accumulating faster than ships can carry it out. If you drove past in July, you'd see mountains of logs stretching across the terminal. |
| Fall (Aug–Sep) | 22 ha | The drawdown. Export vessels loading for Asian construction markets. Watch the inventory liquidate — 47 hectares back to 22 in six weeks. |
| Winter (Jan) | 5 ha | Rain shuts down logging roads. Mills cut shifts. The Columbia River lumber supply chain exhales. |
See It With Your Own Eyes
Here's what the port looks like from orbit in July versus January. Those reddish-brown rectangles in the upper left are log stacks. The bright white patches are dimensional lumber or tarped material. In July, they're everywhere. In January, the yard is mostly empty pavement.
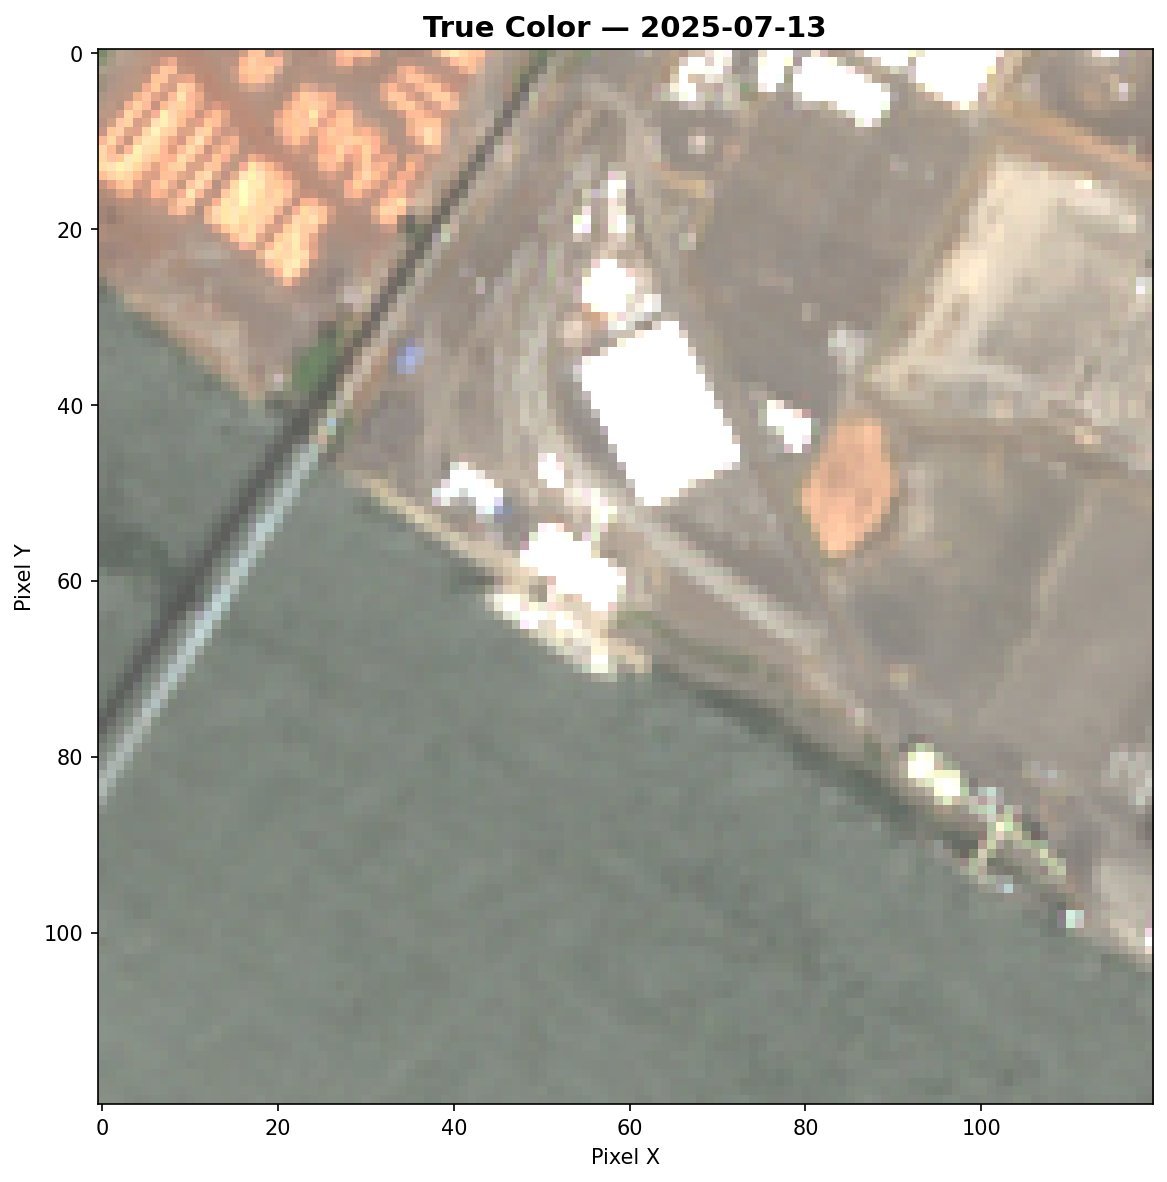
July 13, 2025 — Peak season. Log stacks and lumber filling the terminal. Columbia River at lower left.
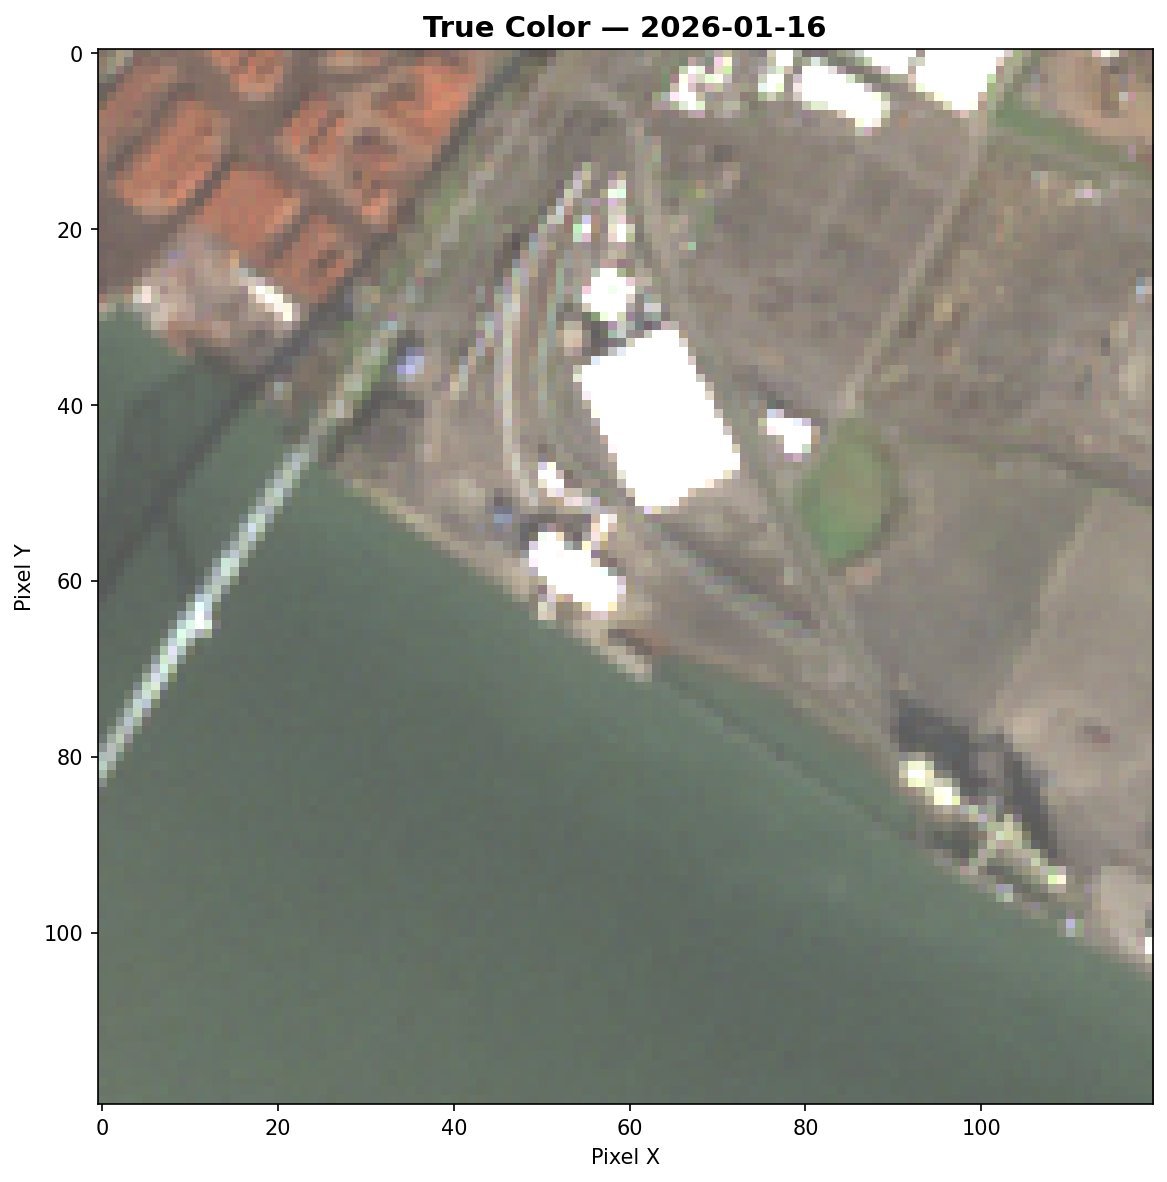
January 16, 2026 — Winter low. Same terminal. Mostly bare pavement. The Columbia has risen with winter rain.
Now here's what the classifier sees — the algorithm's interpretation of the same scenes, pixel by pixel:
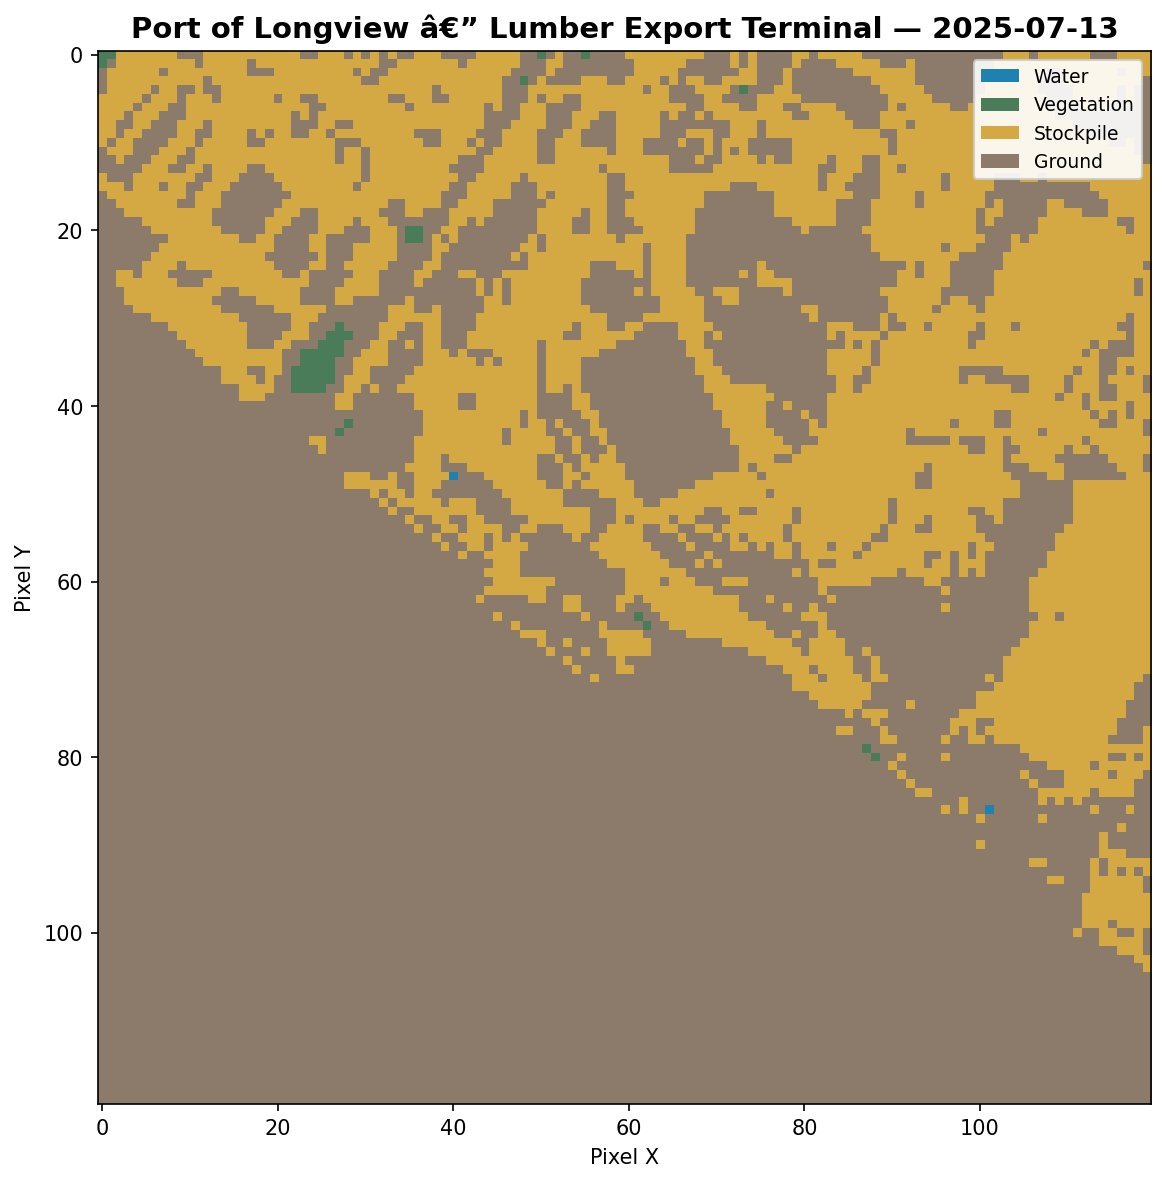
July 2025 — 32% stockpile. Amber = stockpile. Blue = Columbia River. Brown = pavement. Green = vegetation. Nearly a third of the terminal covered in lumber.
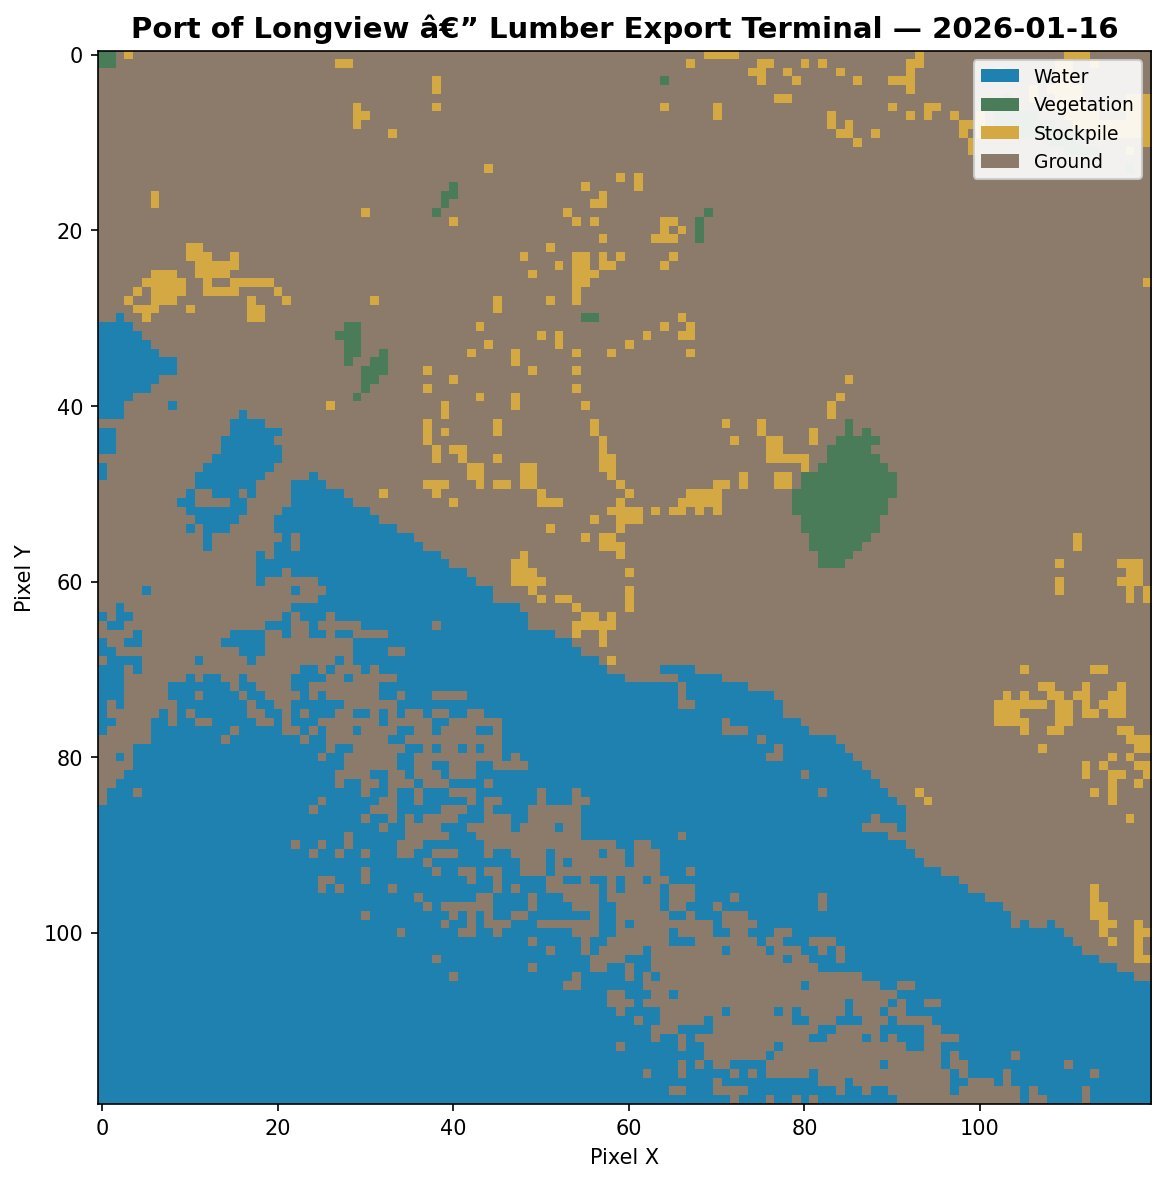
January 2026 — 3.4% stockpile. Same classifier. The terminal has exhaled. Blue dominates as the Columbia River rises. Amber nearly gone.
How the Classification Works
The trick is that different materials reflect light differently in ways the human eye can't fully resolve but multispectral sensors can. Sentinel-2 captures six spectral bands — visible light plus near-infrared and shortwave infrared — and we compute indices that quantify these reflectance differences.
| Index | What It Does |
|---|---|
| NDVI | Vegetation index — identifies trees and grass so we can exclude them from stockpile counts |
| BSI | Bare soil index — separates textured surfaces like lumber stacks from smooth pavement |
| Brightness | Catches the actual stockpile material, which reflects more light than surrounding terminal surfaces |
Each pixel gets classified as water, vegetation, stockpile, or ground. Count the stockpile pixels, multiply by the pixel area (100 m² each), and you have a measurement in square meters. Do it across 32 scenes over 12 months and you have a time series. The thresholds that separate "stockpile" from "ground" were tuned empirically — looking at the satellite imagery with human eyes, comparing it to the classification output, adjusting until the amber pixels land where the actual lumber sits. Part science, part craft.
"This is the seasonal pulse of a $40 billion industry, visible from space, measured with free tools, and reproducible by anyone with a laptop."
Why This Matters Beyond Lumber
The Port of Longview lumber cycle is a proof of concept for a broader class of analysis. The same spectral classification approach works for anything that accumulates visibly at a fixed outdoor location:
This is the kind of analysis hedge funds pay six figures a year for — satellite-derived commodity intelligence that moves faster than official reports. Sentinel Stockpile is proof you can build the same thing with open data, open tools, and a pixi environment.
The Architecture
Each monitoring site is a JSON config file. Each commodity type has its own classification thresholds. The pipeline runs via GitHub Actions on a monthly cron — downloading fresh Sentinel-2 scenes from Microsoft Planetary Computer, classifying pixels, computing area measurements, and generating updated time series charts. No API keys. No paid accounts. The European Space Agency and Microsoft provide everything for free.
Current sites: Port of Longview (12-month time series, complete), Port of Tacoma containers (configured, threshold tuning in progress), Weyerhaeuser Longview (configured). Next up: Sentinel-1 SAR integration to see through the PNW cloud gap that blanks out optical imagery from October through January. Radar fills the winter hole.
The project is open source at github.com/bdgroves/sentinel-stockpile. Add a site config, run the pipeline, get a time series. Point it at something interesting.