On Tuesday, October 13, Aimee and I drove the Icefields Parkway from Banff to Jasper. We’ve driven it several times over the years, and it still delivers every time. If the Colorado Rockies are beautiful, this stretch of the Canadian Rockies is the Colorado Rockies on steroids. This time the road was dry, the sun was out, and October was being far more generous than it has any obligation to be this far north, with much less snow than on our earlier trips.
Partway up, the road climbs over Sunwapta Pass and the big tongue of the Athabasca Glacier swings into view across the valley. It had pulled back noticeably since our last visit, only a few years ago. That’s the strange thing about a glacier: it looks enormous, ancient and permanent, and yet a few years between visits is enough to see it losing ground. Most people stop at the Columbia Icefield Centre and look out over a wide, rocky valley floor to the ice. There are little signposts on the trail out to the toe that mark where the ice used to end, and the years on them get closer and closer to the glacier as you walk.
Those signposts are the heart of a story that’s hard to see standing still, because a glacier changes too slowly to watch. So I tried to show it. After my flight up the Icefields Parkway, I pointed forge3d at this one view, from just above the Icefield Centre lookout, and let the years run: from 1844, when the ice reached almost to where the Centre stands today, through the present, to 2100.
The Athabasca Glacier from above the Icefield Centre lookout, 1844 to 2100 · terrain NRCan MRDEM 30 m · Sentinel-2 imagery, August 2025 · ice thickness Farinotti et al. 2019 · projections OGGM v1.6.3 · rendered with forge3d 1.42
in 1844
gone, 1844 to today
meltwater reaches
in 2100, middle scenario
The roof of the Rockies
The Athabasca is one tongue of something much bigger. The Columbia Icefield sits on the Continental Divide along the Banff–Jasper boundary, a plateau of snow and ice of roughly 200 to 230 square kilometres, depending on who’s measuring and when, up to 365 m (about 1,200 feet) thick, and ringed by some of the highest peaks in the Canadian Rockies. Mount Columbia, on its western edge, is the highest point in Alberta at 3,747 m. Six major glaciers pour off it, and the Athabasca and the Saskatchewan are the best known.
Here’s the bit I love: the meltwater goes to three oceans. Water off the Athabasca Glacier heads down the Athabasca River toward the Mackenzie and the Arctic Ocean. The Saskatchewan Glacier feeds the North Saskatchewan, which crosses the prairies to Hudson Bay and from there the Atlantic. And the icefield’s western side drains into the Columbia, which runs all the way to the Pacific past the bottom of my own state. The name Athabasca comes from Cree, often given as “grass or reeds here and there,” and it was first a name for Lake Athabasca, far downstream.
For European explorers the icefield was a late discovery. The British climbers J. Norman Collie and Hermann Woolley first reported it in 1898, after making the first ascent of Mount Athabasca. Indigenous people had hunted and traded across these passes long before that. The road came later still. Work on what was then called the “Wonder Trail” began in 1931 as a Depression-era project for 600 unemployed men, and the modern paved Icefields Parkway was finished by 1961.
The view from the lookout
Stand at the Icefield Centre and look across at the glacier, and you’re standing about where its snout was in the 1840s. Ben Gadd, the Jasper naturalist who wrote the interpretive guide to this walk, puts it plainly: in 1844 the Athabasca was about 8 km long, “reaching all the way to where Icefield Centre is now.” Today it’s about 6 km.
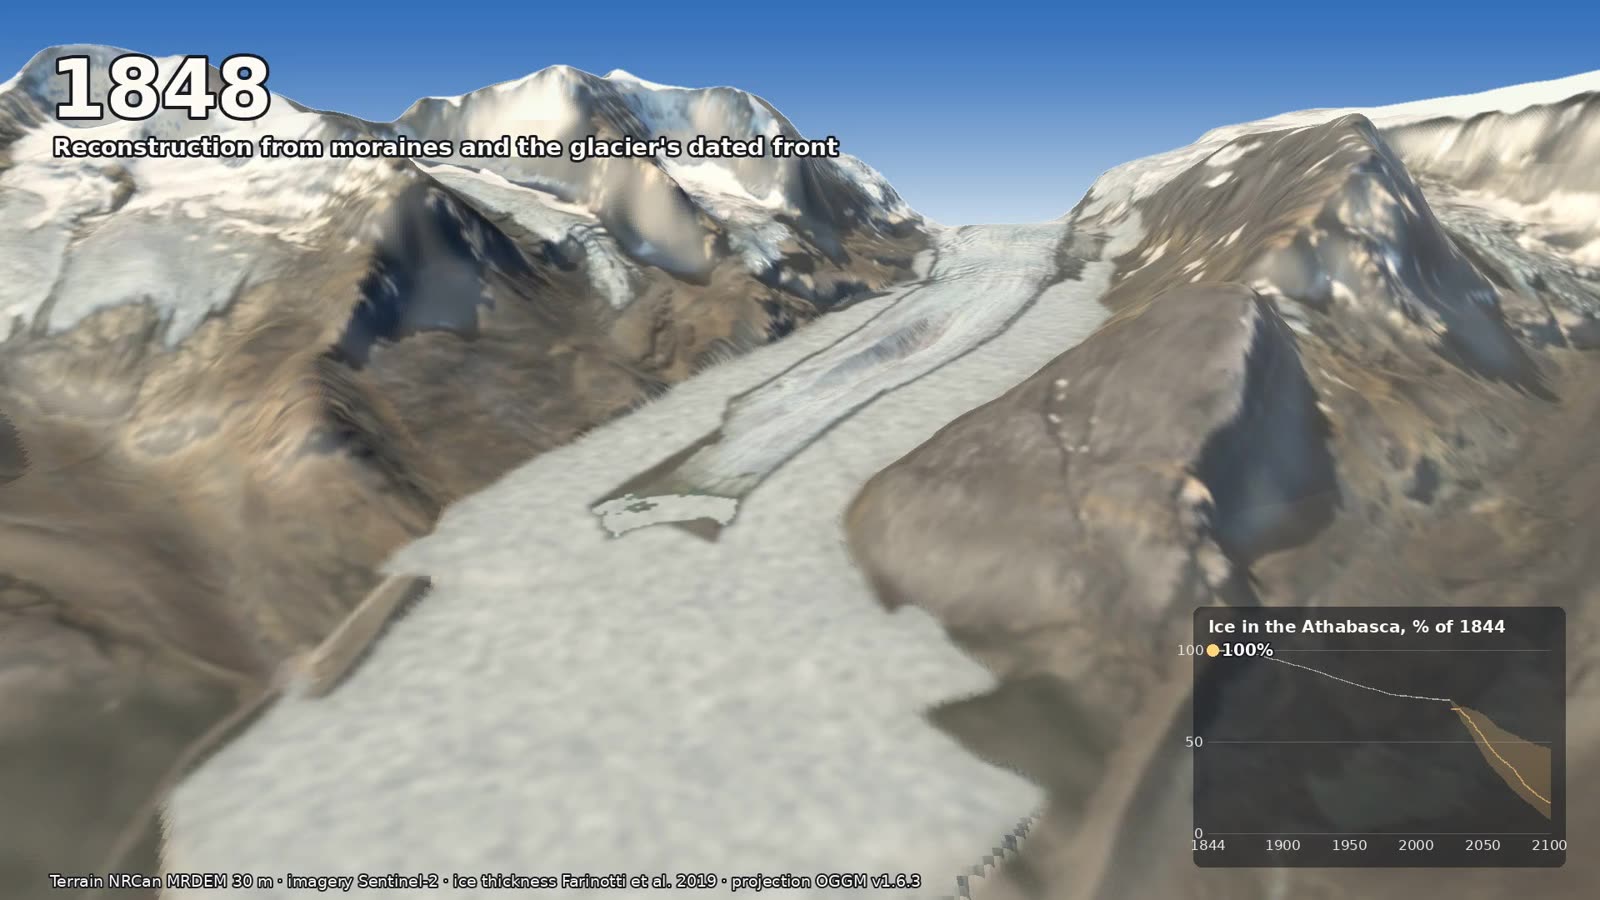
The late 1840s, near the Little Ice Age high stand: the tongue fills the valley almost to the lookout. Click any image to enlarge.
The ground itself tells you where the ice was. On both sides of the valley, long ridges of loose rubble run down toward the road. Those are lateral moraines, the rock the glacier carried along its edges and dropped there, and the ice once stood as high as their crests. At its highest, the east moraine stands about 124 m above the valley floor. Down by the road, a curving terminal moraine marks the mid-1840s front, and trees several metres tall now grow on it. Walk toward the glacier and the plants get smaller and sparser until, near the ice, there are none at all. You’re walking forward in time through ground the ice gave up.
A little ice age, and the long retreat
The 1840s were the high-water mark of what’s called the Little Ice Age, a few centuries of cooler weather that eased off in the late 1800s. Tree rings show the Columbia Icefield’s glaciers advancing and pulling back in cycles, with the latest big advance peaking in the 1840s. Since then the trend has been one direction. The toe pulled back about 1.5 km between 1870 and 1981, and about 1 km of that came between 1919 and 1979. These days it gives up something like 10 to 25 m each summer, and the glacier loses about 5 m of depth a year.
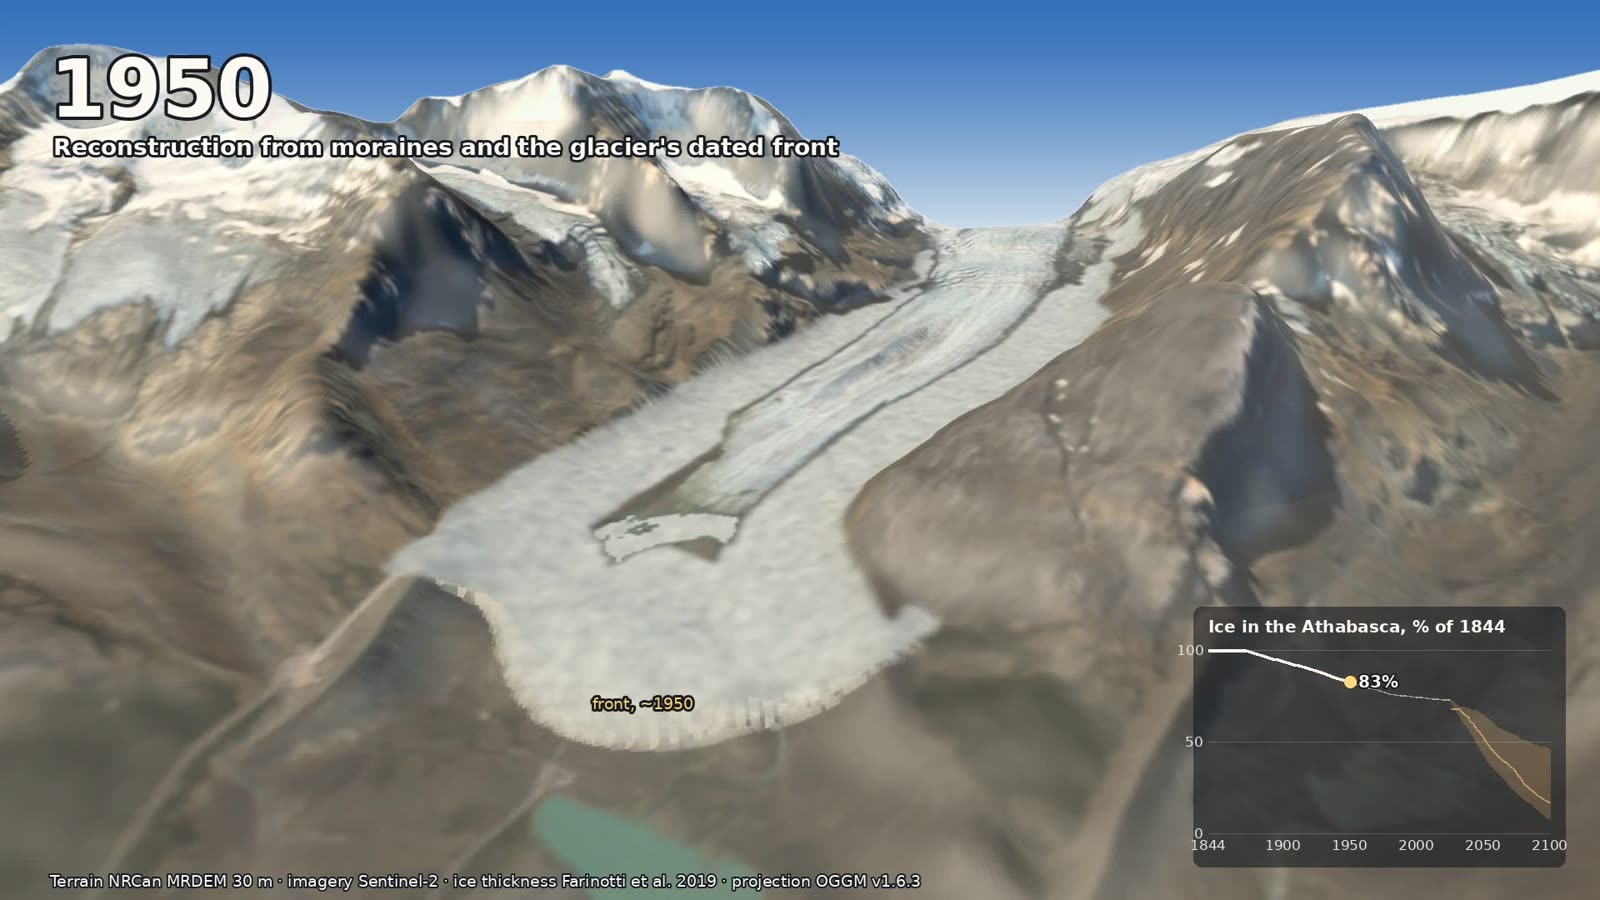
Around 1950 in the film: the front has backed up the valley, and the chart reads 83% of the 1844 ice.
We can also see it in photographs. In 1917 the surveyor Arthur Oliver Wheeler set up his camera just below Wilcox Peak and photographed the Athabasca. In 2011 the University of Victoria’s Mountain Legacy Project found his exact spot and took the same picture again. Side by side, they’re a wonderful way to see a century of change in a single glance.
You’ll often read that the glacier has lost half its volume. My own numbers come out lower for the glacier as a whole: about 2.26 km³ of ice in 1844 and about 1.64 km³ today, so a little over a quarter gone. Much of the thick ice up toward the icefall hasn’t changed much yet, and the loss is concentrated low down, in the tongue you see from the road. So the difference probably comes from which part of the glacier gets counted. Either way, it’s a lot of ice.
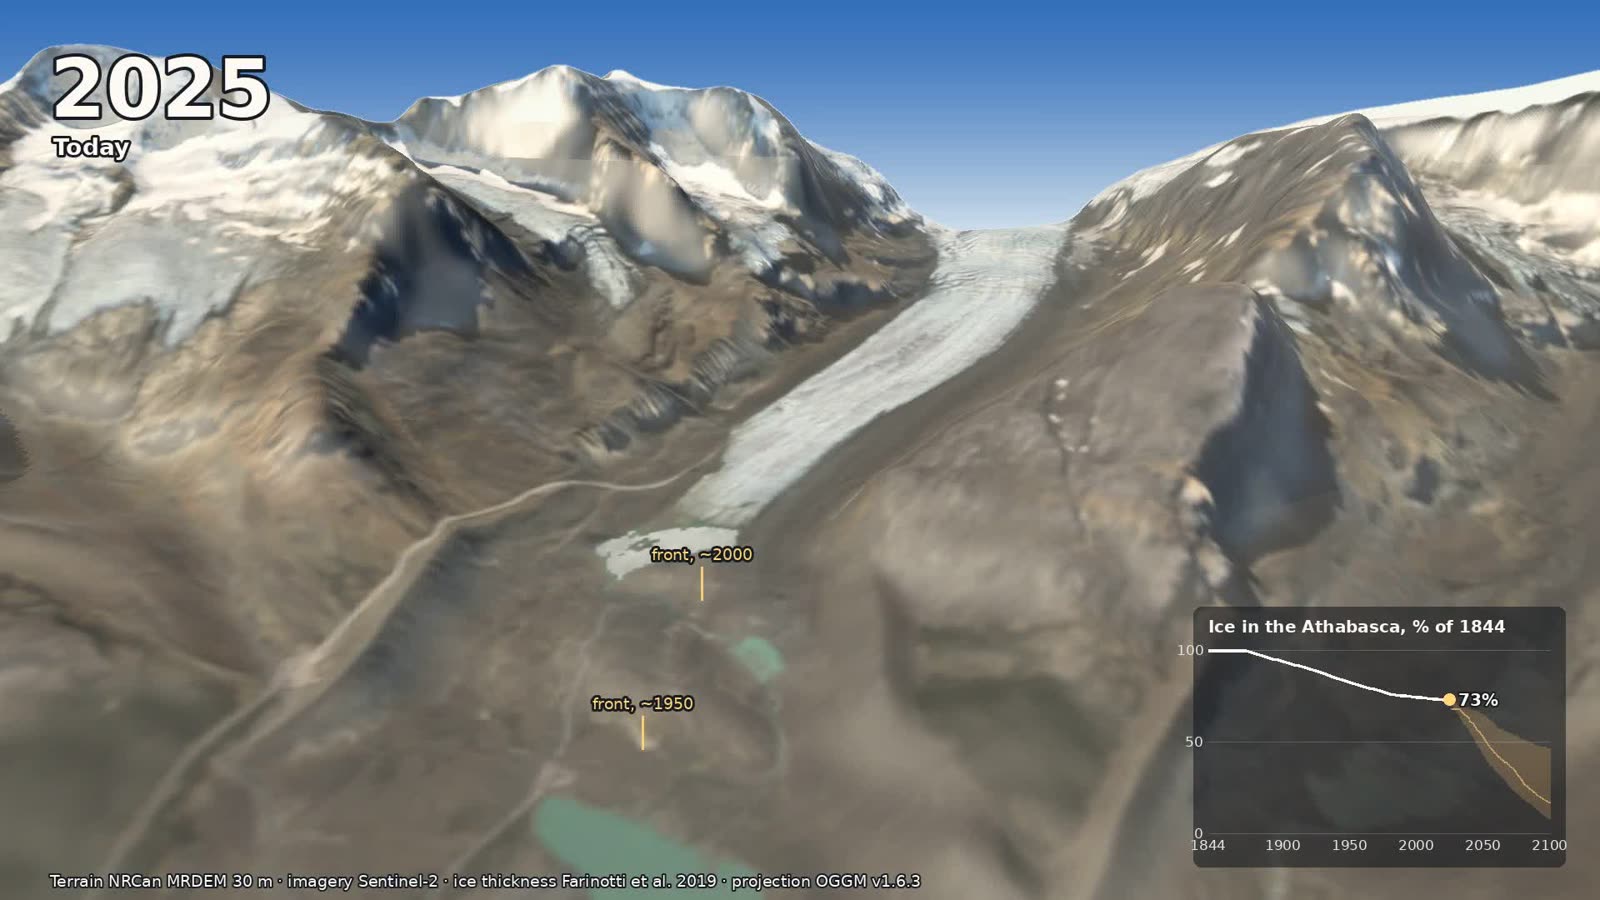
Today. The posts mark the front around 1950 and around 2000, a bit like the signposts on the real trail.
What comes next
For the future I used the Open Global Glacier Model (OGGM), an open-source model that projects every glacier on Earth, one at a time, under many climate models. Its runs for the Athabasca give the glacier’s volume and length each year to 2100 under three emissions scenarios, from SSP1-2.6, where the world cuts emissions hard, to SSP5-8.5, where it doesn’t. The film follows the middle path, SSP2-4.5, using the median of 14 climate models.
On that middle path, the front pulls back about another 1.2 km by 2050, and by then about half of the 1844 ice is left. Through the 2060s the tongue withdraws to the foot of the icefall. By 2100 there’s no glacier left on the valley floor in front of the Icefield Centre, and about 17% of the 1844 ice remains, tucked up high where you can’t see it from the lookout. Parks Canada’s own summary is similar: the glacier “may be gone by 2100.”
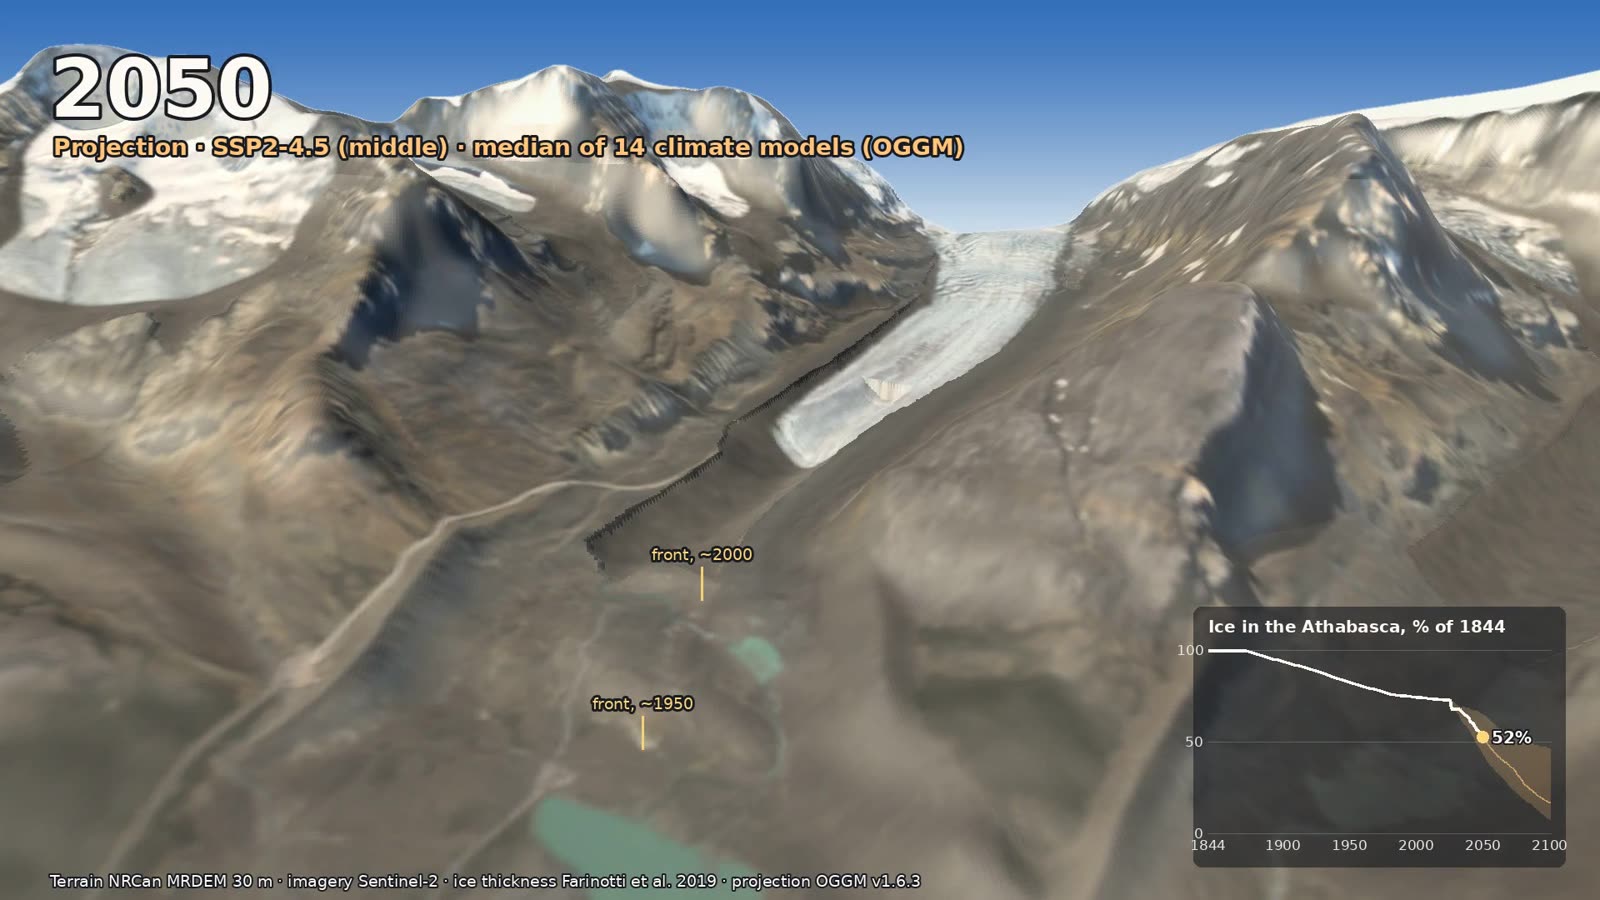
2050, middle scenario: a short tongue below the icefall, and about half the 1844 ice left.
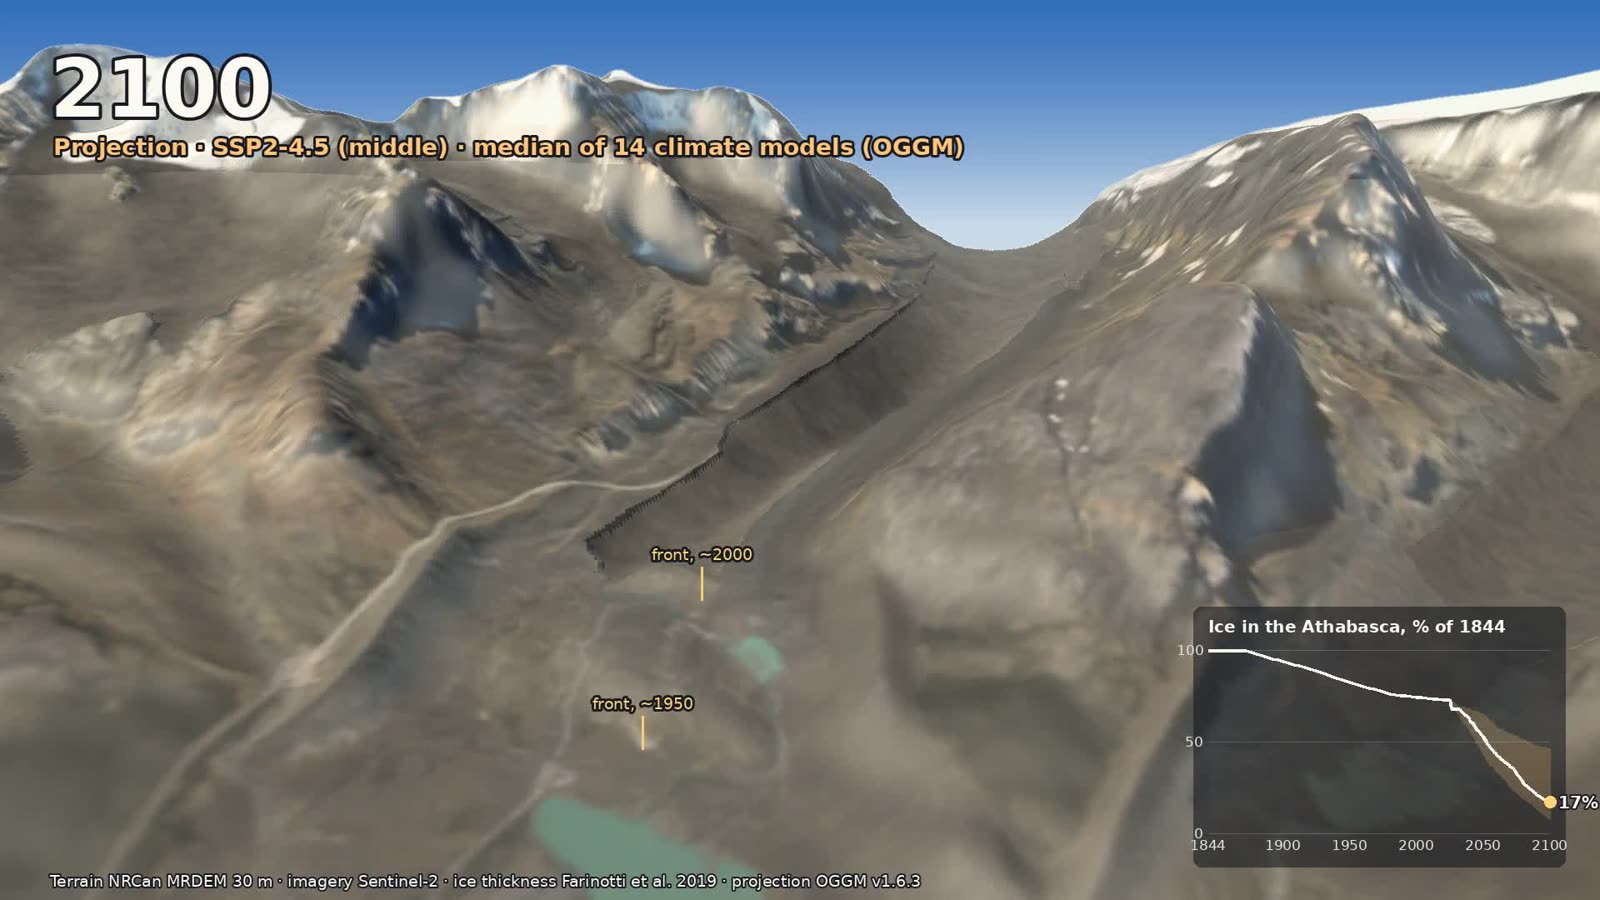
2100, middle scenario: the valley is bare up to the notch where the icefall was.
That’s the middle road, though, and the road isn’t picked yet. That’s why the film ends with a card showing all three. Relative to the ice in 2020, the models’ median leaves about 37% under low emissions, 22% under the middle path and essentially none under high emissions. The spread between climate models is wide (the low path ranges from 12% to 80%), but the order never changes: the less warming, the more glacier.
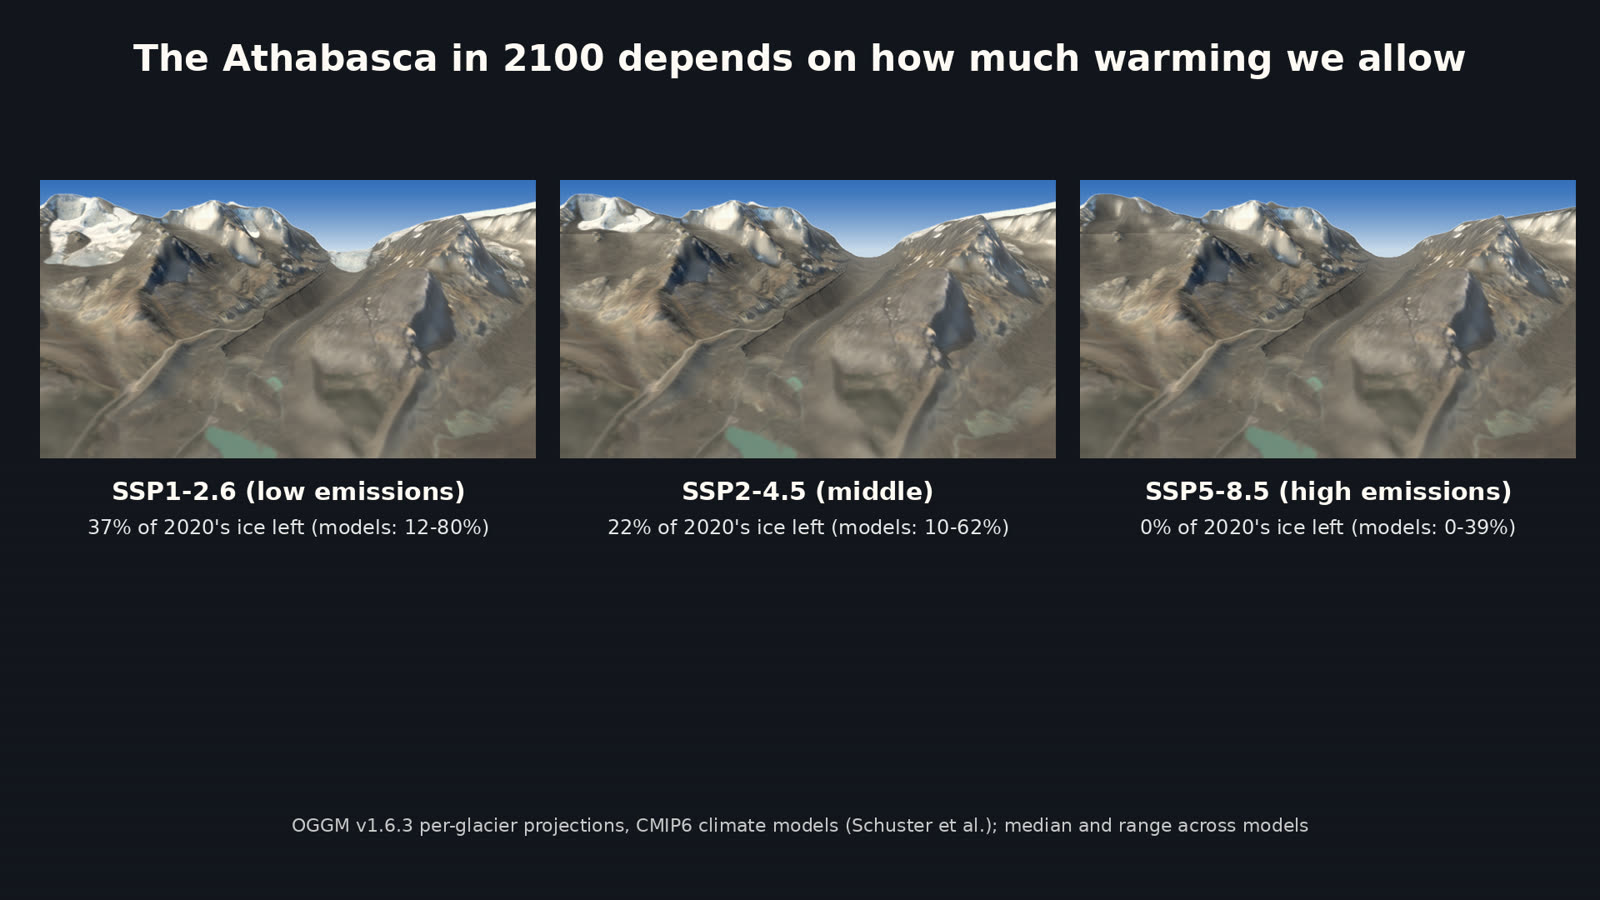
The end card: the Athabasca in 2100 under low, middle and high emissions, with the range across climate models.
The bigger picture says the same thing. A 2015 study led by Garry Clarke at UBC projected that western Canada’s glaciers will lose about 70% of their 2005 volume by 2100. A 2023 global study in Science led by David Rounce put it in a phrase I like: every increase in temperature matters. Their numbers run from losing about a quarter of the world’s glacier mass between 2015 and 2100 at 1.5 °C of warming, to about 40% at 4 °C. For a glacier like the Athabasca, those tenths of a degree are the difference between a tongue you can walk up to and a view of bare rock.
Why the ice matters downstream
Glaciers act like a savings account for water. Snow falls on the icefield in winter, and the ice gives it back slowly through the summer, most of all in late summer and in dry years, just when the rivers need it. Glacier melt is a small but important part of the flow in the Bow, North Saskatchewan and Athabasca rivers in those dry spells. John Pomeroy and his team at the University of Saskatchewan have spent years measuring it here.
Wildfires play a part too. Caroline Aubry-Wake, then a PhD student in Pomeroy’s group, tracked the Athabasca through six melt seasons, from 2015 to 2020. She found that smoke can shade the ice for a while, but the soot it leaves behind darkens the surface, and over those summers that boosted melt by a little over 10%. Smoky summers are now a part of how these glaciers melt.
How it’s made
The view is a real place, built from open data. The terrain is Natural Resources Canada’s 30 m Medium Resolution Digital Elevation Model, resampled to 10 m. Canada’s high-resolution lidar doesn’t cover the icefield, so 30 m is the best there is up here. The color is a cloud-free Sentinel-2 satellite image from 24 August 2025. I separated ice, bare ground and the little meltwater lakes with simple band ratios, so the old ice can be painted onto ground that’s bare today. The glacier outlines come from the Randolph Glacier Inventory, and the ice thickness under them from the Farinotti et al. (2019) consensus estimate, which gives the shape of the bed the glacier sits on.
The past is a reconstruction, built so that it matches what we know. The 1844 surface rises toward the published height of the lateral moraines, then blends back into today’s ice up the glacier. The front follows the dated positions above (on my map it’s 1.6 km from the 1840s moraine to the toe in the glacier inventory, whose outline dates from the mid-2000s, a bit shy of Gadd’s “nearly 2 km”), and near the front the ice thins the way real snouts do, following a simple physical rule for how thick ice can be at a given distance behind its edge. As a check, my reconstruction loses 0.31 km³ between 1919 and 1979. That’s a little more than the 0.23 km³ Reynolds and Young measured from maps for the lower glacier alone, as you’d expect when the whole glacier is counted. Today’s volume matches OGGM’s to within 1%.
The future uses OGGM’s year-by-year volume and length. The front retreats by OGGM’s change in length, and the ice behind it thins in the pattern Matthias Huss and colleagues worked out for large glaciers, which puts most of the thinning near the toe. The thinning is solved each year so the volume lands right on OGGM’s. The neighboring glaciers on Mount Athabasca and Mount Andromeda follow their own OGGM runs.
A few honest limits. At 30 m, the ridges are softer than lidar would make them. Everything before today is a careful reconstruction, not a photograph. And the camera sits about 220 m above the lookout, more like a drone than a person, so the old tongue doesn’t hide behind its own moraine. It was all rendered without a graphics card, split into 40 pieces on GitHub’s free computers. The code is on GitHub, in the melt folder.
If you’re driving the Parkway, give yourself the hour to walk the Toe of the Athabasca trail and read the signposts. It’s about 1.4 km there and back, and please stay behind the barriers. The ice is beautiful and full of hidden crevasses.
We carried on to Jasper that evening, our first visit since the 2024 wildfire. The town is still rebuilding, but Jasper is still Jasper, and it was good to show up: a Hazy Does It IPA outside at Jasper Brewing, dinner at The Raven, one of our favourites. For some reason “Dancing in the Moonlight” followed us around in our heads all day. Travel gives you two ways to see a place: what’s beautiful about it, and what’s changing. The Parkway gives you both, and the Athabasca is the best reminder I know that even a landscape this grand is in motion. Go see it.
Sources: Gadd (2011), GeoVista: Athabasca Glacier / Icefield Centre · Bath Geological Society (1985): The Athabasca Glacier · The Canadian Encyclopedia: Columbia Icefield · Wikipedia: Columbia Icefield · Athabasca Glacier · Athabasca (name) · Parks Canada: a brief history of the Icefields Parkway · Parks Canada: Ice · Mountain Legacy Project: Focus on Ice and Snow · Tennant & Menounos (2013) · Clarke et al. (2015) · Rounce et al. (2023) · Wildfire smoke accelerates glacier melt (USask, 2022) · CBC: The canary in the icefield · National Parks Traveler: Toe of the Athabasca Glacier.
Go deeper
Glaciers: What Future? — Mountain Voices (UIAA), 17 March 2025, about 53 min. Ice climber Will Gadd and repeat-photographer Mary Sanseverino on the Athabasca Glacier and why its retreat matters.
Climbing Canada’s melting glaciers — The Current (CBC), 14 January 2026. Mountain guides on how shrinking ice is changing routes on the Athabasca, Mount Athabasca and the Wapta Icefield.
The canary in the icefield — CBC News interactive, with video from the field in August 2023. John Pomeroy’s team on Peyto Glacier, and why larger glaciers like the Athabasca could still be saved.
Great Northern Wilderness: Across the Great Divide — National Film Board of Canada, 2005, 52 min. Tom Radford’s journey from the prairie over the Divide to the Pacific, past the Columbia Icefield where rivers part for three oceans.
Gadd, B. (2011). GeoVista: Athabasca Glacier and Icefield Centre. Earth Sciences Canada. A short, friendly field guide to the walk from the Centre to the toe.
Tennant, C. & Menounos, B. (2013). Glacier change of the Columbia Icefield, Canadian Rocky Mountains, 1919–2009. Journal of Glaciology 59(216), 671–686. The icefield lost about 23% of its area over those 90 years.
Clarke, G.K.C., Jarosch, A.H., Anslow, F.S., Radić, V. & Menounos, B. (2015). Projected deglaciation of western Canada in the twenty-first century. Nature Geoscience 8, 372–377.
Rounce, D.R. et al. (2023). Global glacier change in the 21st century: Every increase in temperature matters. Science 379, 78–83.
Aubry-Wake, C., Bertoncini, A. & Pomeroy, J.W. (2022). Fire and ice: the impact of wildfire-affected albedo and irradiance on glacier melt. Earth’s Future.
Farinotti, D. et al. (2019). A consensus estimate for the ice thickness distribution of all glaciers on Earth. Nature Geoscience 12, 168–173.
Mountain Legacy Project — Wheeler’s 1917 Athabasca photo and its 2011 repeat, and thousands more. · OGGM — the open glacier model behind the projections. · Randolph Glacier Inventory — outlines of every glacier on Earth.
NRCan MRDEM — Canada’s elevation model. · Copernicus Sentinel-2 — the satellite imagery. · forge3d — the Python terrain renderer. · icefields-flyover — this project’s code.