A month ago I wrote about secchi, my little window into the University of Nevada, Reno's sensor network around Lake Tahoe. Since then it has kept quietly collecting: sondes out in the lake, loggers along the shore, forest stations up the slopes, plus USGS stream gauges and snow stations. All told it's about 12 million readings, and they all live in a set of files on GitHub.
Lots of organizations are moving their SQL Server databases into Microsoft's Azure cloud right now, and I wanted to know what that's really like. Not from a slide deck, but by doing it, start to finish, with data I know well. So on Wednesday morning I picked up the whole lake and moved it.
By lunch, every reading was in Azure, checked against the original month by month. A schedule keeps it current every other morning, and QGIS draws the map straight from the cloud. Here's how it went, including the parts that surprised me.
Step one: count everything
Before moving anything, I made a list of every table: how many rows, which months, what feeds it, what reads it, and whether it should move at all. Three of the files turned out to be secchi's own bookkeeping, which doesn't belong in a database. Three more could wait until something needed them.
Then came the important part. For every table and every month, I took a fingerprint: the row count, a checksum of every row's key, the first and last times, the smallest and largest values, and a sum of the values. That's the "before" picture. The whole move hangs on it, because the question at the end isn't "did it load?" It's "is it the same?"
Step two: copy, then prove it
I built the tables in SQL Server first: lookup tables for the sites and variables, a compressed column store for the 12 million readings, and real geography for the stations. Then I bulk-loaded it all with Microsoft's bcp tool. On a throwaway SQL Server in GitHub Actions that takes under a minute. Azure took about four and a half, mostly my home internet uploading 870 MB.
Then SQL Server computes the same fingerprints from what it holds, and they have to match exactly. They did: 131 of 131 table-months, 12,108,026 rows, plus a spatial test. SQL Server and secchi's own Python each worked out which catchment every station sits in, and they agreed on all of them.
The check found some fun things along the way:
- Capital letters. One kind of logger reports
Temperatureand another reportstemperature. To SQL Server's default settings those are the same word, so my first load stopped with a duplicate. A case-sensitive setting on the names fixed it. - A garbled apostrophe. One note in the Secchi disk record reads "doesn’t", an apostrophe scrambled somewhere before it reached me. I moved it exactly as it was, and the checksum proves it arrived byte for byte. A move is no time to fix data. Fixes come after, on purpose.
- Metres, not degrees. The catchment outlines were stored in Web Mercator metres with no label saying so. They're converted once, with the same code the old system uses, and the spatial test confirms it.
- An 85 °C lake. The very first question I asked the Azure copy was the lake's monthly temperature, and one sonde said 85 to 102 °C last spring. That's a sonde that failed, already written up. It moved unchanged, as it should. Views in the database label readings like that, so maps and reports can leave them out without anyone deleting the record.
The best moment: my check was too kind
To keep the cloud copy current, I wrote a sync. It compares fingerprints and reloads only the months that differ, so it catches revised history as well as new readings. To test it, I sabotaged the copy on purpose: I deleted a month of lake readings and nudged one stream-gauge reading up by 1. The sync had to find exactly those two months and repair them.
It found the deleted month. It did not find the +1.
That's because I had let the sums differ by a tiny amount per row for rounding, and over a month of 60,000 readings, that tiny amount added up to 6. When I took the allowance out, I learned something better: the rounded sums had never matched exactly. The two engines round a few rare numbers differently. So the morning's "131 of 131" had been true for rows, keys and times, but the value sums had been passing on my allowance.
The fix was to compute something both engines agree on exactly, the sum of each value times 1,000 with the decimals cut off, and to allow no difference at all. Now a change of 0.001 anywhere gets caught. I'd much rather learn that from my own sabotage test than from someone downstream, and the correction now sits in the write-up, right next to the claim it corrects.
Keeping it current, and keeping it free
Every other morning, GitHub Actions wakes the Azure database, syncs it, checks everything, and writes a line to a run log. A few details I'm happy with:
- No stored Azure password. GitHub hands each run a short-lived token, and Azure trusts tokens from this one repository's main branch only.
- The firewall opens for that run's address alone, and closes again when it's done, even if something fails.
- A failed run opens an issue on GitHub, so I hear about it.
It runs on Azure SQL Database's free offer: 100,000 vCore-seconds of computing a month, set to pause rather than bill if it runs out. The surprise was what a run costs. The sync itself takes about four minutes, but the database stays awake for an hour afterwards before it pauses, and on the free offer you can't shorten that hour. So one run costs about 1,800 vCore-seconds, almost all of it idle time. Running every night would use more than half the month's allowance. Every other day uses about a quarter. I measured it instead of guessing, and every run now writes down how much free time is left, so the bill is just another column in the data.
The map
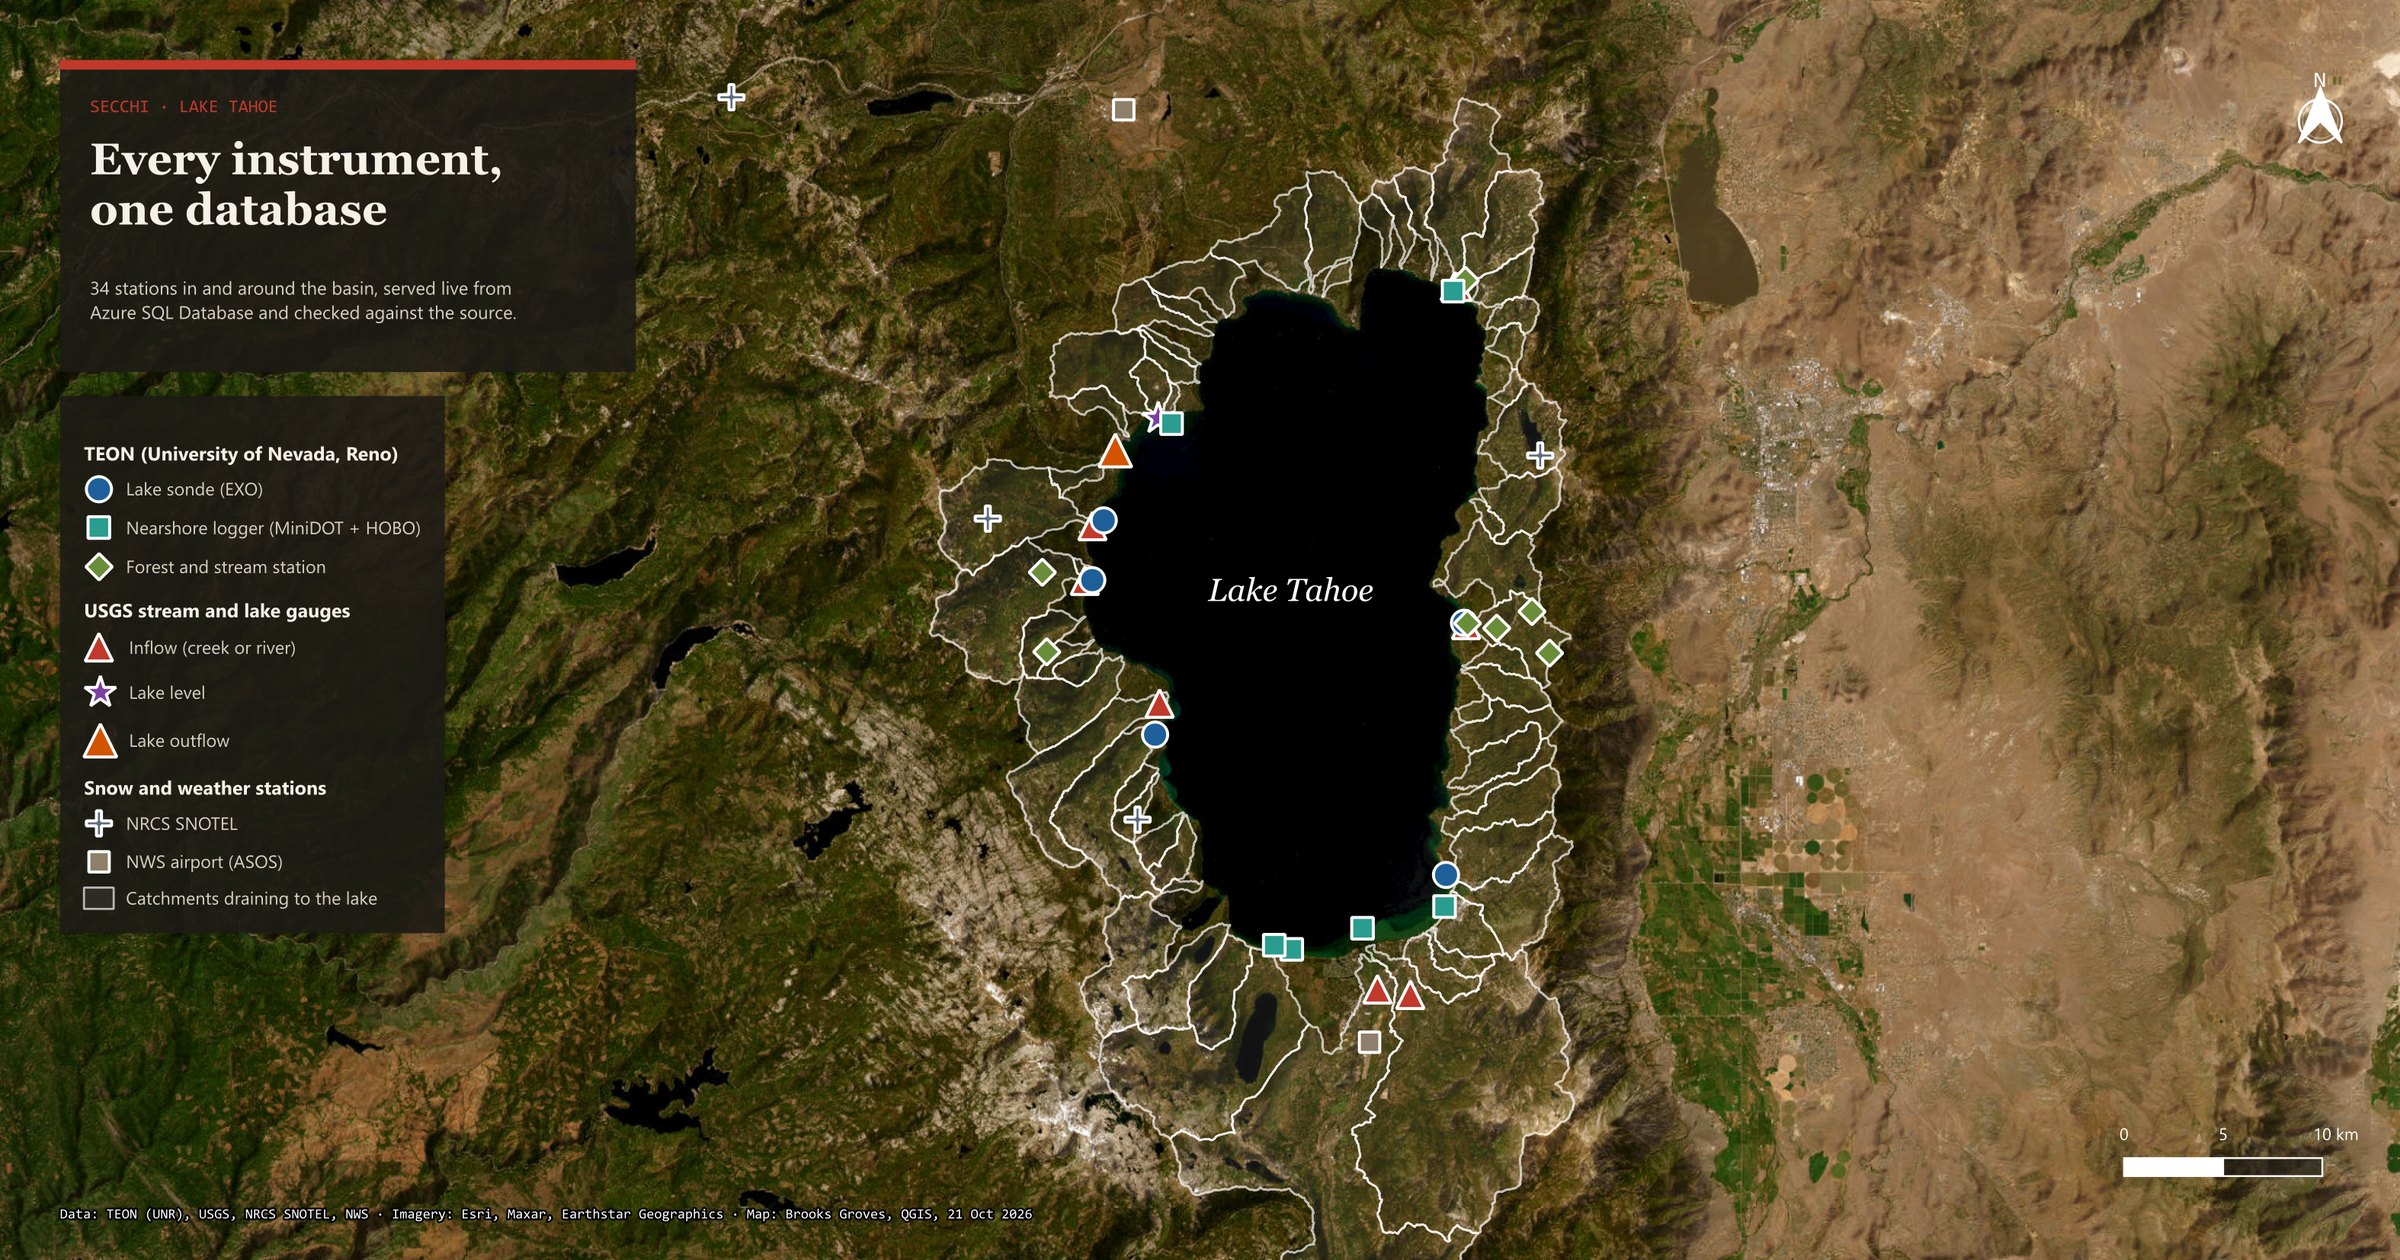
This was the part I was most excited about. QGIS connects to Azure with a read-only login and reads five map views that live in the code and get rebuilt on every sync, so the map can't drift away from the data:
- TEON's 18 sites, by kind: 5 sondes out in the lake, 6 nearshore loggers, and 7 forest and stream stations, some with cameras (2,738 frames so far).
- 10 USGS gauges: 8 creeks and rivers flowing in, the lake level at Tahoe City, and the Truckee River flowing out. Hover over one and it shows the latest flow. On Wednesday morning the Truckee was carrying 78.7 cubic feet per second out of the lake.
- Daily flow and monthly lake temperature, with a time slider you can play like a little movie.
- Snow and weather stations as context: four SNOTEL sites and the Truckee and South Lake Tahoe airports.
Before trusting the map, I checked a few of its numbers against the original files: the camera frame count, the latest flows, and the number of gauge-days. They matched. My own first count of gauge-days was 2 short, and that turned out to be a time-zone slip in my check, not in the data. It seems I still have to learn that lesson about once a week.
How I worked with AI
I built this with Claude Code, an AI coding assistant, the same way I've built most of secchi. It drafts quickly, and I direct, review and decide. What makes me trust the result isn't who typed it. It's the checks: 201 tests before every change, the exact reconcile, and the sabotage test that caught my too-kind allowance. I wrote down how that works, including what went wrong and what caught it. And I wrote the whole method up as a runbook for anyone moving many databases instead of one. Inventory, copy, prove, run side by side, watch the bill.
Then I did it again, in C#
That afternoon I wanted to see the same move from the .NET side, since C# is what a lot of SQL Server shops build with. So I wrote a small C# program, secchi-cloud, that does two jobs the Python side already did, but its own way.
The first is a check. It reads every one of the 12 million rows back out of SQL Server and does all the arithmetic itself: the checksums, the counts, the exact smallest and largest values, and the sum, kept as a whole number with no size limit so nothing rounds. Now there are three independent versions of the fingerprint: DuckDB on my files, SQL Server's own, and C#. All three agree, 131 of 131 table-months, to the last digit. To make sure it wasn't just agreeing politely, I changed one stream reading by 0.001 in a copy of the export, and C# flagged exactly that month.
The second is a loader. bcp is Microsoft's command-line tool for bulk loading; SqlBulkCopy is the same idea built into .NET. So, naturally, I raced them, reloading all 12 million readings each way:
| Loader | Time | Result |
|---|---|---|
| bcp | 26 s | 131 of 131 match |
| SqlBulkCopy, first try | 41 s | 131 of 131 match |
| SqlBulkCopy, streaming | 25 s | 131 of 131 match |
My first try lost by a lot. It read 100,000 rows at a time into an in-memory table, then sent them, and all that packing and unpacking adds up. The fix was to let SqlBulkCopy read straight from the file, one row at a time, as fast as the server takes them. That brought it level with bcp. Call it a tie, since one run on a shared computer can wobble by a few seconds. The C# loader also checks every value on the way in, and stops with the line and column if anything doesn't fit, which bcp doesn't do.
One surprise along the way: Microsoft's SQL Server library refused to connect at all because of a setting I'd turned on to make number parsing identical on every computer. It turns out the library needs the language data to understand SQL Server's text settings. One line in the project file, and a good reminder that the first failure is often the most educational one. The whole thing builds and runs on my Windows PC too, and I wrote a plain-words walkthrough of the C#, file by file, for anyone curious how it fits together.
What's next
secchi's files on GitHub stay the original. The cloud copy is a practice twin that proves itself every other morning. Next I'd like to point ArcGIS Pro at the same views, port the last few data-quality flags, and maybe let the live secchi page show when the cloud copy last matched. Meanwhile the lake keeps doing what it's done for two million years, and now it has one more place to keep score.
Go deeper
secchi in SQL Server and Azure SQL Database — the full write-up: the four steps, what "matches" means, costs and results. · The runbook — the same method for many databases. · How AI is used here. · How the C# works — a walkthrough, file by file.
A Plate on a Rope — the first secchi post, about the sensors and the lake. · The Handoff — the same "prove it matches" idea, from COBOL to C#.
secchi — the live dashboard. · Tahoe Environmental Observatory Network (UNR). · USGS Water Data.