Work
10 featured projects and eight fields: live dashboards, lidar atlases and the analyses behind them.
Featured projects
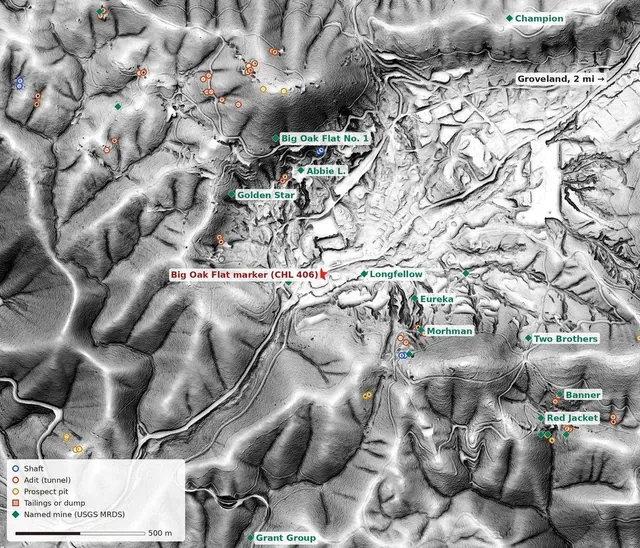 ⛏️ Mother Lode: Gold Country in LidarThe gold belt where I grew up, with the trees peeled away. Five mining places in bare-earth lidar, from Columbia's limestone pinnacles to the Harvard pit at Jamestown, and every USGS mine feature in Tuolumne County: 1,040 adits, shafts and prospect pits.PythonPDALUSGS 3DEPUSGS USMINUSGS MRDS
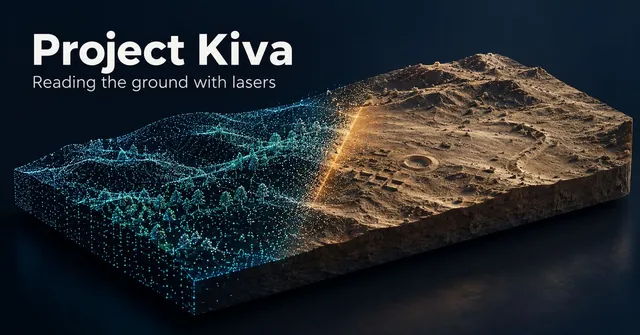 🏺 Project Kiva: Ruins in Bare EarthTwelve archaeological places in bare-earth lidar, from Chaco Canyon to Cahokia and the Wisconsin effigy mounds. Peel back the aerial photo, switch between relief views that make walls, mounds and ditches show, and turn each site in 3D.PythonUSGS 3DEPLidarRelief Viewsforge3d
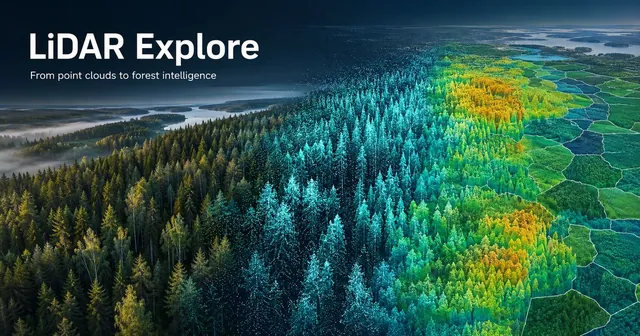 🌲 LiDAR Explore: From Point Clouds to Forest IntelligenceA synthetic Finnish forest with every tree known, then 1,840 real stands checked against Finland's national inventory. Spin the point cloud, thin the laser and watch detection fall apart, and click any stand. Rebuilt from the open data on GitHub.PythonPDALlaspyrasterioLeaflet
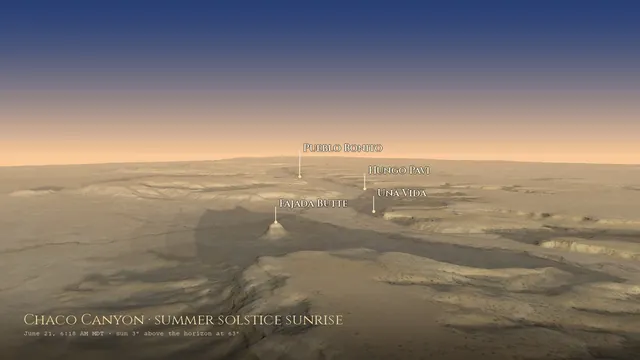 ☀️ SOLSTICE: The Sky Over ChacoThe live Sun and Moon over Chaco Canyon, each great house's real skyline with every sunrise of the year, and a forge3d flight down the canyon at solstice dawn.PythonPyEphemforge3dUSGS 3DEPLeaflet
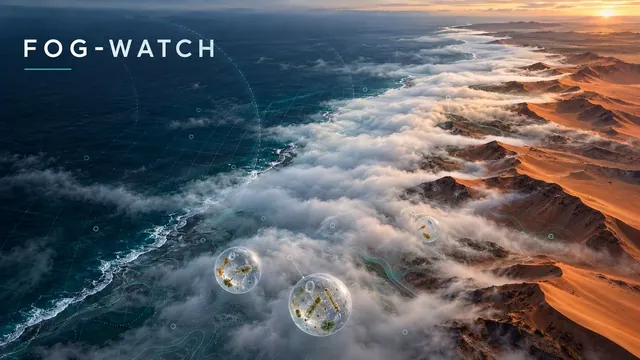 🌫️ FOG-WATCH: Where the Fog LivesA fog climatology for the world's great fog coasts: the Namib, the Atacama and San Francisco. Ten years of hourly ERA5 turned into a fog-blanket map with a month slider, an inland transect past Gobabeb, and heatmaps of exactly when the fog rolls in.PythonERA5Open-MeteoD3Leaflet
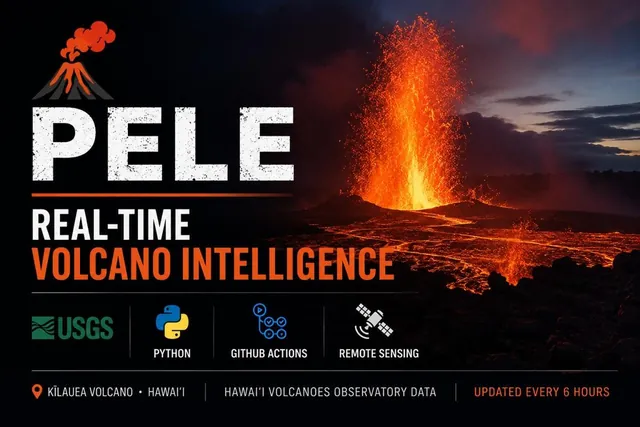 🌋 PELE: Hawaiʻi VolcanoesKīlauea is in an ongoing eruption at Halemaʻumaʻu, fountaining in episodic bursts since December 2024. PELE tracks it live — real-time summit earthquakes, HVO webcams, alert levels, and a full episodic-fountaining log. Refreshes every six hours, no human in the loop.PythonUSGS HVOGitHub ActionsLeafletHVO Webcams
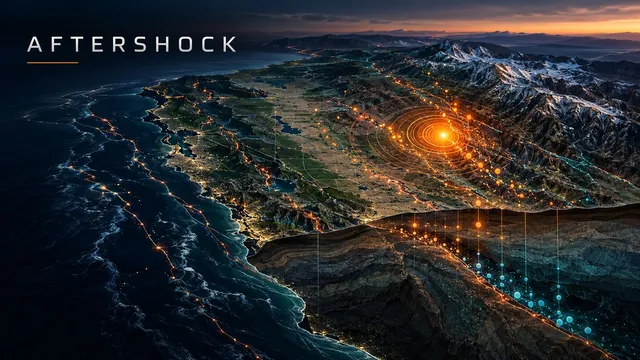 🌍 AFTERSHOCK: Real-Time Seismic MonitorA live earthquake dashboard for the US and the world — pick any state or country, compare it with ten years of normal, and follow aftershock sequences as they decay. Built to watch the ground that watches us.PythonUSGS FDSNLeafletGitHub ActionsGeoJSON
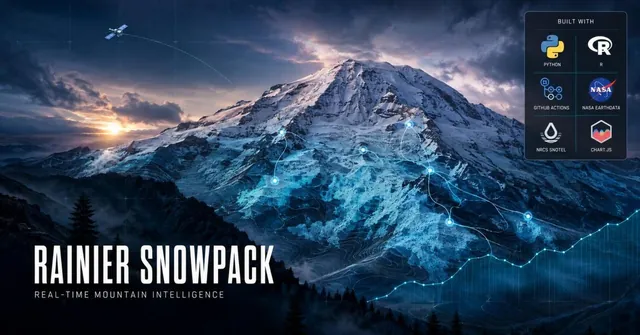 ❄️ STORM CHASER: Rainier SnowpackAutomated Mt. Rainier snowpack monitoring — 7 SNOTEL ground stations and NASA MODIS, hourly. Nine panels track basin SWE, melt, freeze-thaw, and live NPS webcams. Runs every hour, forever, all winter and through the melt-out.PythonRGitHub ActionsNASA EarthdataNRCS SNOTEL
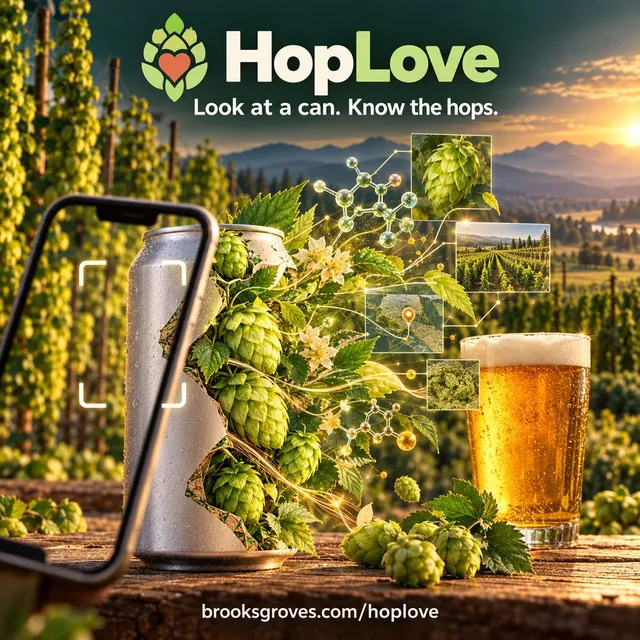 🍺 HopLove: Know Your HopsEvery hop spec sheet hands you one confident number. HopLove keeps every source's number instead — Hopsteiner, BarthHaas, the Hop Breeding Company, Indie Hops — and shows you where they disagree. 232 varieties, Washington and Oregon acreage from USDA, and a can-to-hops lookup for 2,000+ beers from 32 Pacific Northwest breweries, from Stoup and Georgetown to Block 15 — a camera button that reads the hops off any can, and my Untappd check-ins and ratings joined to the hops in each glass.NodePythonJSON SchemaUSDA NASSpixi
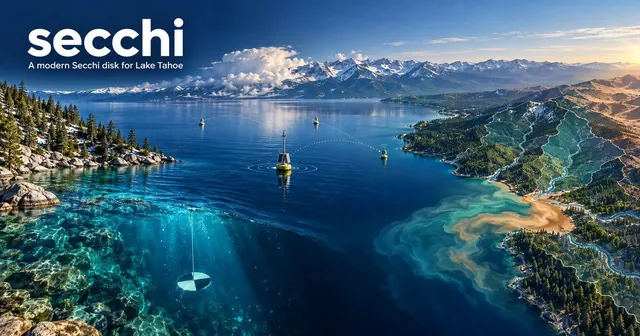 🔵 secchi: A Modern Secchi Disk for Lake TahoeLive water-clarity readings from the Tahoe Environmental Observatory Network — three YSI EXO sondes around the lake, sampled every fifteen minutes, cross-checked against USGS gauges on the tributaries. An undocumented API, forty-three sensors that turned out to be thirteen devices, and a five-digit parameter code that turned out to be the pollutant the TMDL actually regulates.PythonTEON APIUSGSLeafletpixi
By field
🌩 MeteorologyWeather pipelines, atmospheric analysis, and forecast automation.
💧 HydrologyStreamflow, snowpack, and water-resource tracking across the Sierra and Cascades.
🗺 GeospatialGIS and remote sensing in Python, R and QGIS, led by a study of how far West Coast wildfires burn from fire stations.
🌋 VolcanologyLive eruption monitoring and lahar hazard tracking.
🦕 PaleontologyMachine-learning fossil-locality prediction: finding where to dig next.
🌿 EcologyProjects mapped from GBIF and iNaturalist: cui-ui, golden trout, pikas, island lizards and kangaroo rats.
🪨 GeologyGold country in bare-earth lidar, and the ground that shakes.
🏺 ArchaeologyAncient places in lidar, and the sky the builders watched.
Every project is open source: the code is on GitHub, and the posts behind them are here, by topic.