Every November the mapping world plays the #30DayMapChallenge: one map a day, one theme a day. Day 1 is Points. My own Day 1 was every geocache I’ve ever found. Then I saw what my friend Jake Steinberg posted, and I wanted to make one more.
Jake and I came up through the same NACIS mentor program, and it’s been a real joy to watch both of our maps grow since then. Jake is a graphics reporter at the Minnesota Star Tribune, and he just made fifty maps of his home for a book, The Twin Cities in 50 Maps, from Belt Publishing. For Day 1 he shared one of them: every census tract in the Twin Cities as a dot, colored by its largest generation and sized by how many people are in it.
He wrote that he’d been wary of the generations angle, because it can tip into clickbait. But once it was mapped, the stories were right there: where younger people can afford a home and start a family, and where older generations dominate wealthy enclaves like Minnetonka and North Oaks. One tract was led by the Silent Generation, because it holds a senior living community.
I loved it, so I made the same map for two places I know: the Seattle metro, where I live now, and Tuolumne County, California, where I grew up.
the Seattle metro
Millennials
led by Boomers
at the UW
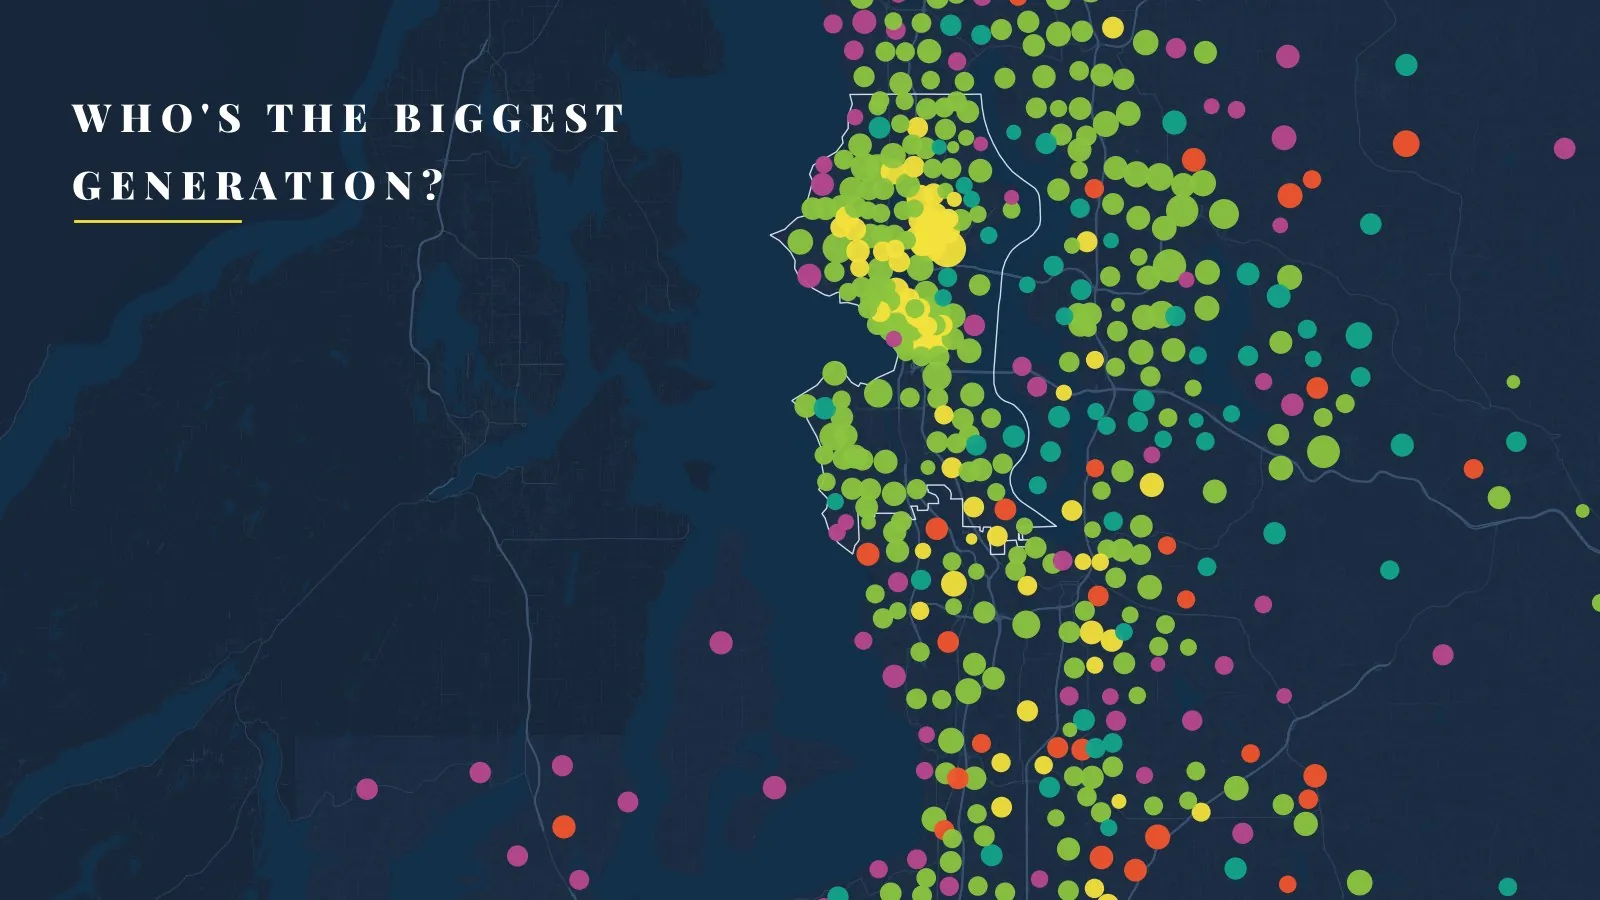
The Seattle metro: a Millennial town, with a yellow heart
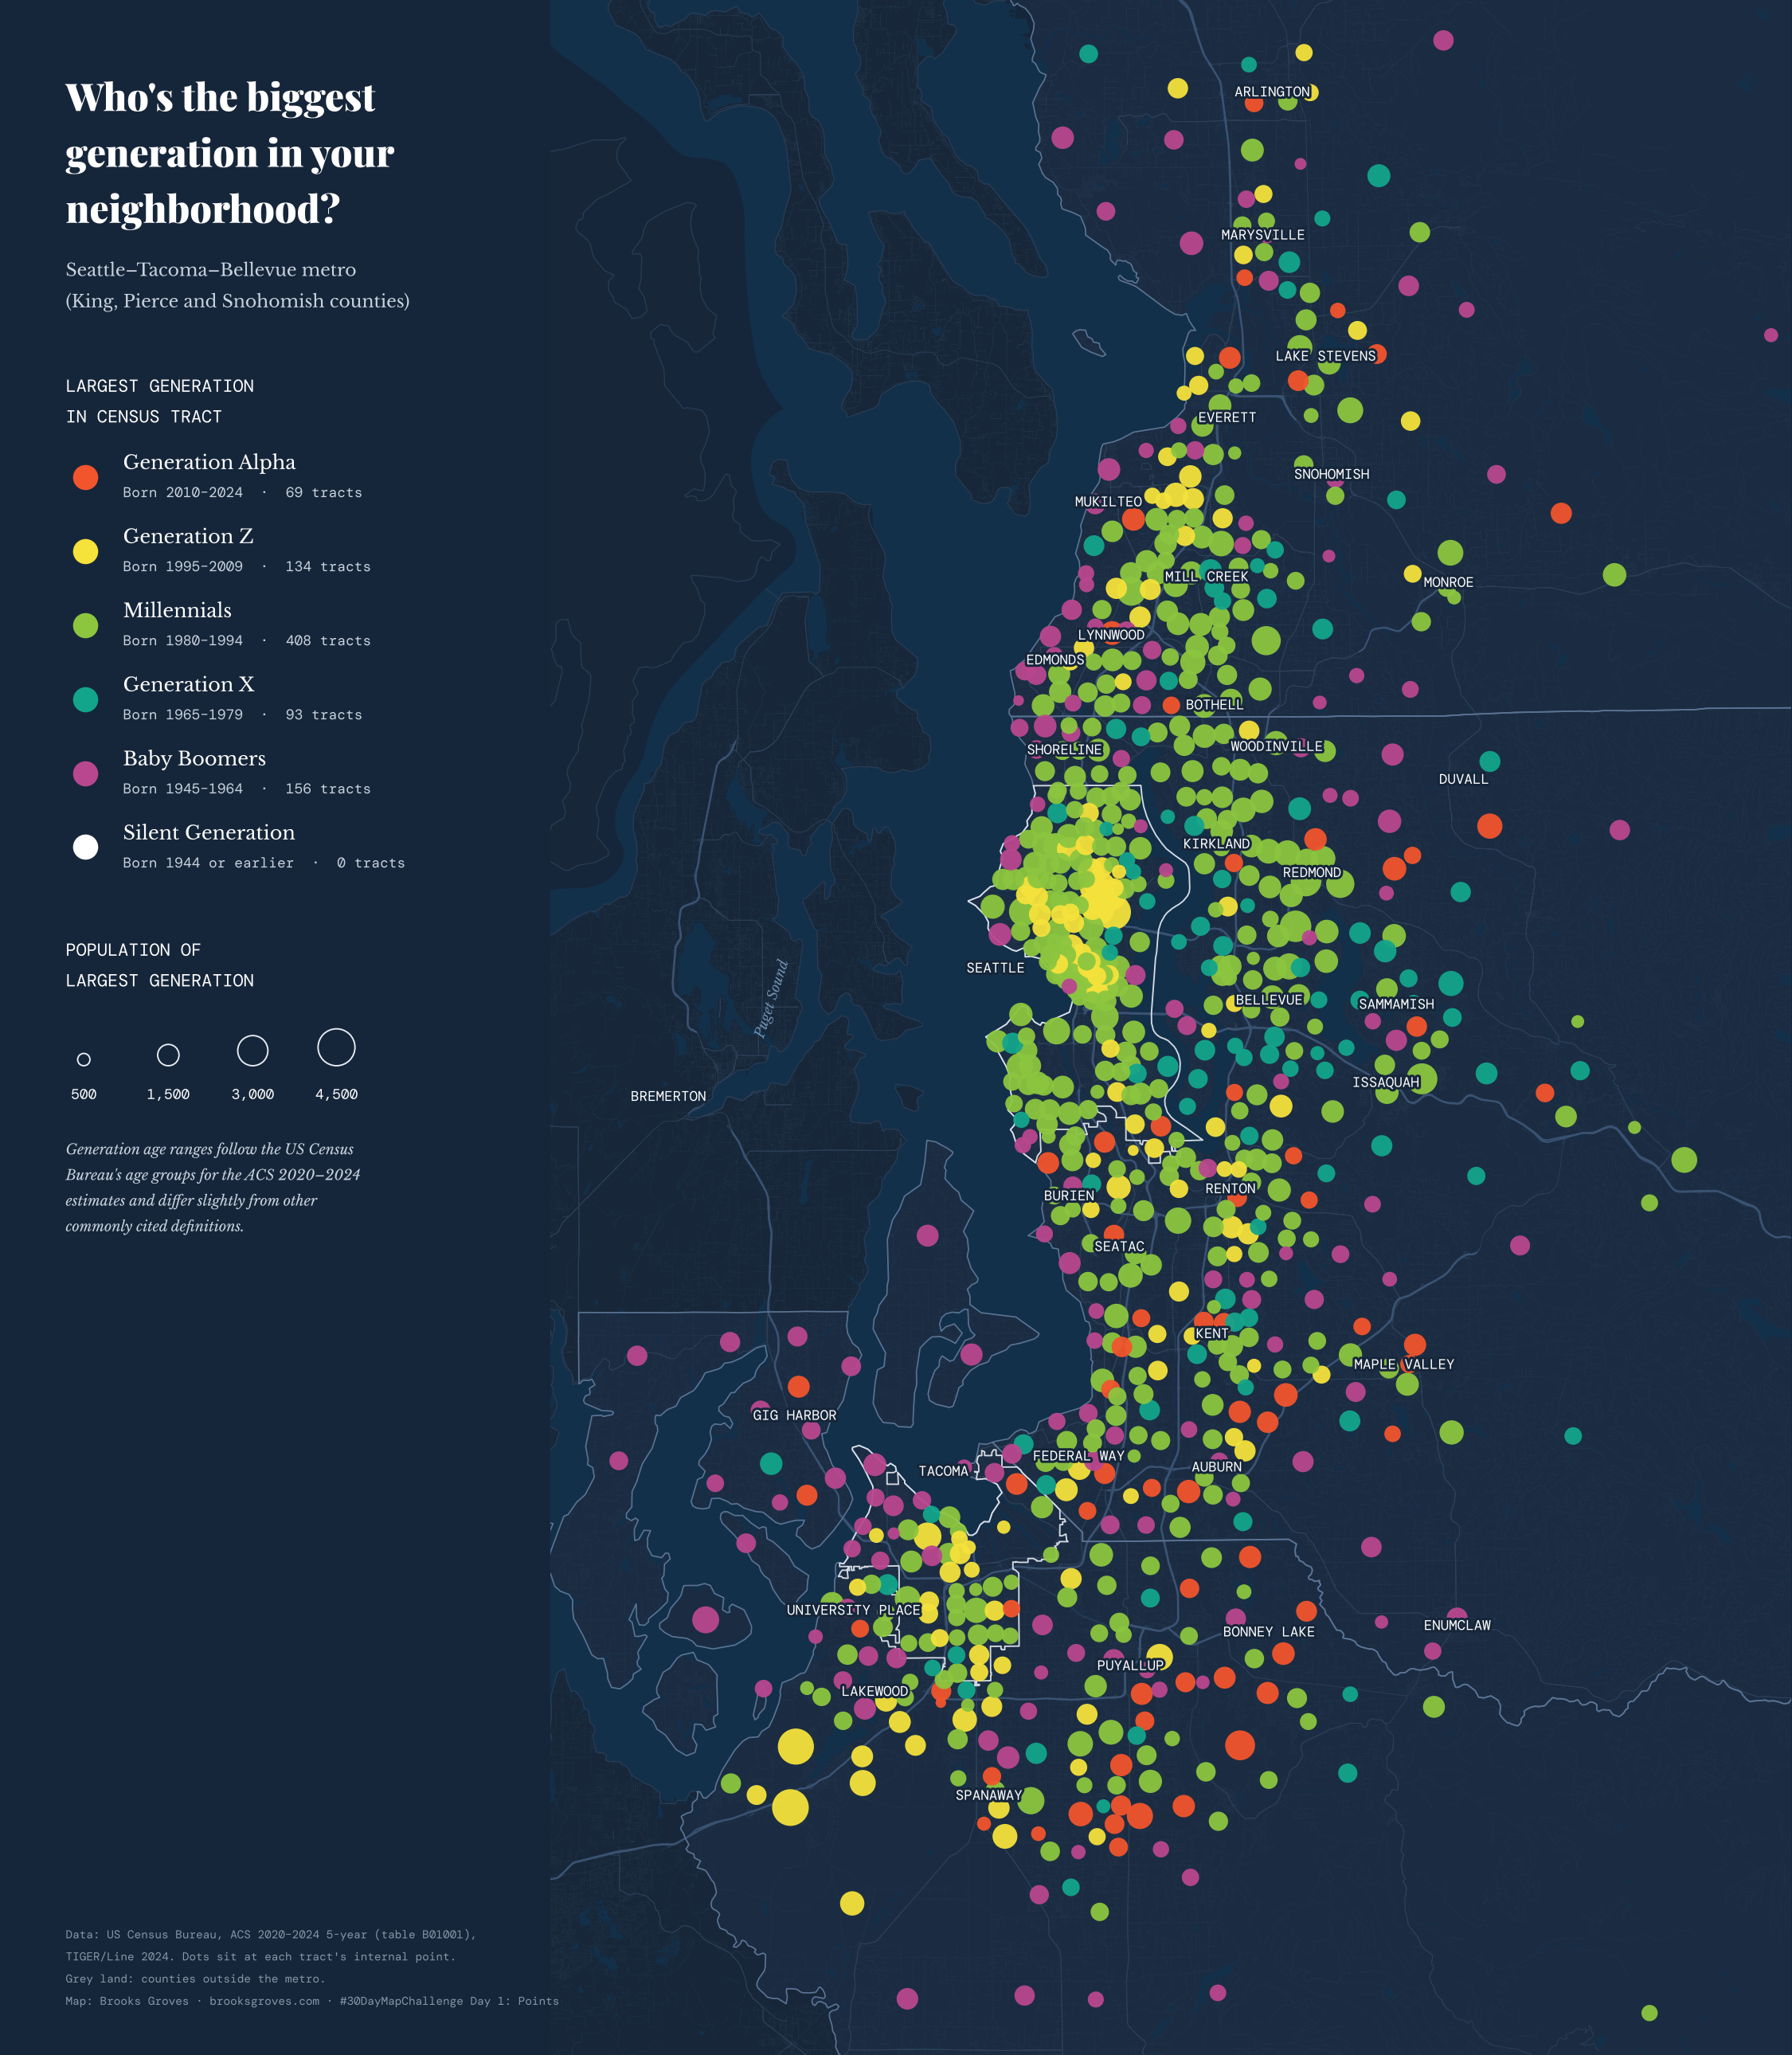
Each dot is a census tract, placed at the tract’s internal point. Color: the generation with the most people. Size: how many people that is. The white outlines are Seattle and Tacoma city limits. Click for the full-size map.
Across King, Pierce and Snohomish counties, Millennials are the largest generation in 408 of the 863 tracts, almost half. They’re also the biggest group overall, about a quarter of the metro’s four million people. Green covers most of Seattle, the Eastside and the I-5 corridor up through Lynnwood and Everett.
The yellow in the middle is the University of Washington. The three tracts on and right around campus are 92 to 98 percent Gen Z: dorms and student apartments. In all, Gen Z leads 134 tracts, including the tracts on Joint Base Lewis-McChord, just down the road from me in Lakewood, where a lot of the people living on base are young service members.
The orange dots are where Gen Alpha, kids born roughly since 2010, outnumber everyone else. Here they cluster in Pierce County suburbs like South Hill, Frederickson and Spanaway, and out toward Lake Stevens and Maple Valley. Same story Jake saw: you can follow the young families out to where a house is a little more within reach.
Boomers lead 156 tracts, many of them around the edges: Vashon, Fox Island, the Gig Harbor and Key peninsulas, and the rural foothills of the Cascades. Gen X leads 93, with a lot of those on the Eastside and Mercer Island. And unlike the Twin Cities, not a single tract here is led by the Silent Generation.
Tuolumne County: almost all one color
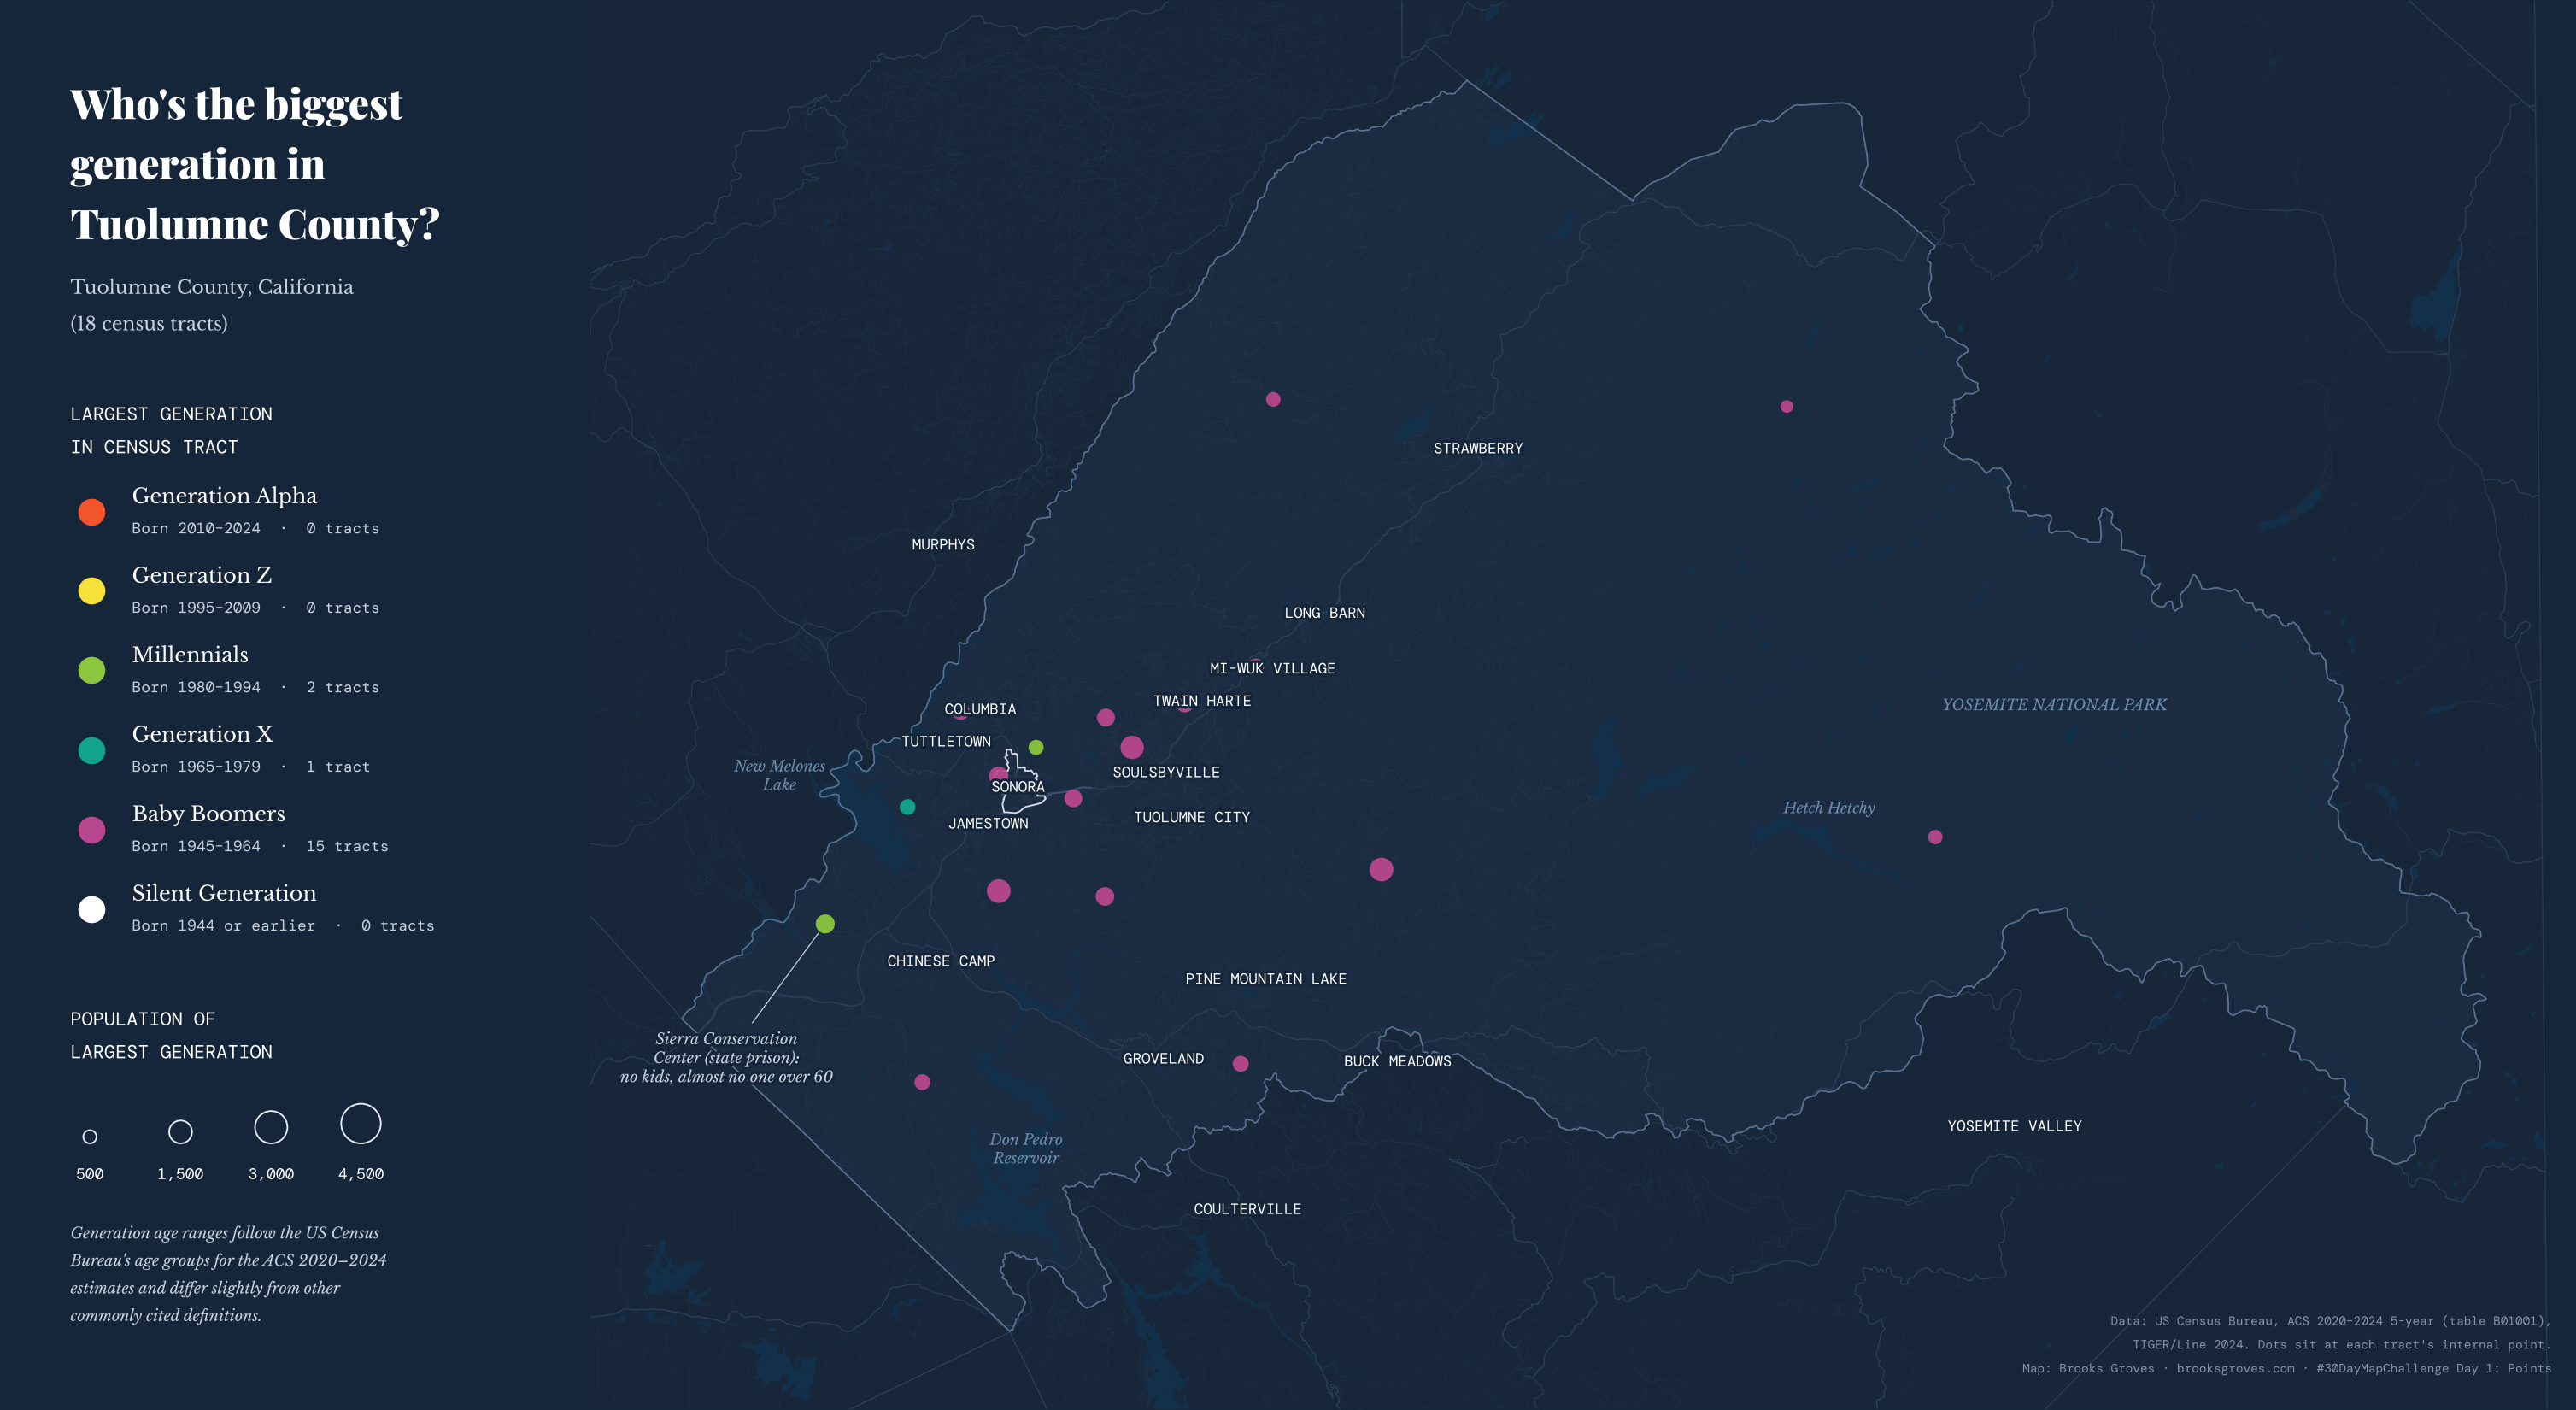
Same colors and the same size scale as the Seattle map (check the legend on each). Click for the full-size map.
Then there’s home. Tuolumne County has about 54,500 people in 18 census tracts, and Baby Boomers lead 15 of them. From Twain Harte and Mi-Wuk Village to Pine Mountain Lake, and around Groveland, where I grew up: magenta, magenta, magenta. Boomers are about 29 percent of the county, compared with about 17 percent of the Seattle metro, and the Silent Generation is more than twice as large a share here as there.
Only three tracts break the pattern. One between Tuttletown and Jamestown is led, just barely, by Gen X. One just north of Sonora is led, also barely, by Millennials. And then there’s tract 9852.02, which is led by Millennials by a mile: about 1,000 of its roughly 2,000 people. It has no children and almost no one over 60, because it’s the Sierra Conservation Center, a state prison near Jamestown. It’s the same lesson as Jake’s senior living tract, from the other end: some of these dots aren’t neighborhoods at all, but institutions.
How I made them
- The numbers. The Census Bureau’s American Community Survey, 2020–2024 5-year estimates, table B01001 (sex by age), for every tract in King, Pierce and Snohomish counties and in Tuolumne County. They’re estimates from a survey, so small tracts carry some wobble.
- The generations. Jake’s legend notes that his age ranges were influenced by the Census Bureau’s age groups. I did the same, using the brackets in table B01001: Gen Alpha 0–14, Gen Z 15–29, Millennials 30–44, Gen X 45–59, Boomers 60–79 and the Silent Generation 80 and up. So the birth years on the legend differ a little from the definitions you may have seen elsewhere.
- The dots. Each tract sits at its “internal point,” a spot the Census Bureau picks inside every tract. A dot’s area grows with the number of people in the leading generation.
- The basemap. TIGER/Line roads, water and city limits, on dark navy in the spirit of Jake’s map, with my site’s fonts.
- The plumbing. A GitHub Action fetches the Census files, and Python with geopandas and matplotlib draws the maps. The data script and the drawing script are on GitHub.
Last thing
Thank you, Jake, for the idea and the inspiration. It’s fun to look back at where we both started in the NACIS mentor program and see where the maps have gone since. If you love maps, or you’ve ever lived in Minneapolis or St. Paul, go get his book: it’s officially out November 17, and preorders are open. And if you make one of these for your own town, I’d love to see it.
Data: U.S. Census Bureau, American Community Survey 2020–2024 5-year estimates (table B01001) and TIGER/Line 2024. Map idea and style after Jake Steinberg’s map in The Twin Cities in 50 Maps (Belt Publishing, 2026).
Go deeper
Steinberg, J. (2026). The Twin Cities in 50 Maps. Belt Publishing. Fifty new maps of Minneapolis and St. Paul.
Defining generations: Where Millennials end and Generation Z begins — Pew Research Center; why the birth-year lines move around.
#30DayMapChallenge — the month’s themes. · My 2026 challenge maps — a new one every day in November. · NACIS — the North American Cartographic Information Society.
American Community Survey — the Census Bureau’s yearly survey. · Table B01001 — sex by age. · TIGER/Line shapefiles — tracts, roads and water.