Between about 18,000 and 15,000 years ago, the ice dam holding back Glacial Lake Missoula kept failing, and each time a wall of water tore across eastern Washington. Mammoths, bison, camels and horses were caught in those floods and buried where the water slowed down and dropped its silt. IceWave was my attempt to find more of them: gather every Ice Age fossil record I could for Washington, Oregon, Nevada, Idaho and Montana, teach a random forest what the ground looks like where they turn up, and ask it where else that ground is.

The project’s flag. The mammoth is standing in water, which turns out to be more on the nose than I knew.
Back in the spring IceWave looked like a winner. Its west model scored an AUC of 0.89. Its east model recognised 36 of 40 held-out fossil sites. And best of all, its number-one east target, E02, seemed to line up with the Coyote Canyon mammoth dig near Kennewick. My README called it a blind validation: “The model called its shot.”
This fall I’ve been coming back to my early projects the way I did with PaleoWave: give each one a real page, wire it to live data, and re-check every number it claims from the files in the repository. IceWave’s re-check was the most humbling one yet. None of those headline numbers survives. I’d rather tell you that myself, with the arithmetic in a script anyone can rerun.
The mammoth was 69 kilometres away
Start with the claim I was proudest of. E02 sits at 46.30°N, 120.13°W, in the Yakima Valley. The Coyote Canyon Mammoth Site is south of Kennewick, 69 km to the south-east. That’s not “the predicted pixel.” It wasn’t blind either: quarry workers found the bones in 1999 and the McBones Research Center has been digging there since 2008. And when I went looking for where the word “VALIDATED” came from in my notebook, I found a line of code that printed it beside whichever target happened to be first in the list. Ouch.
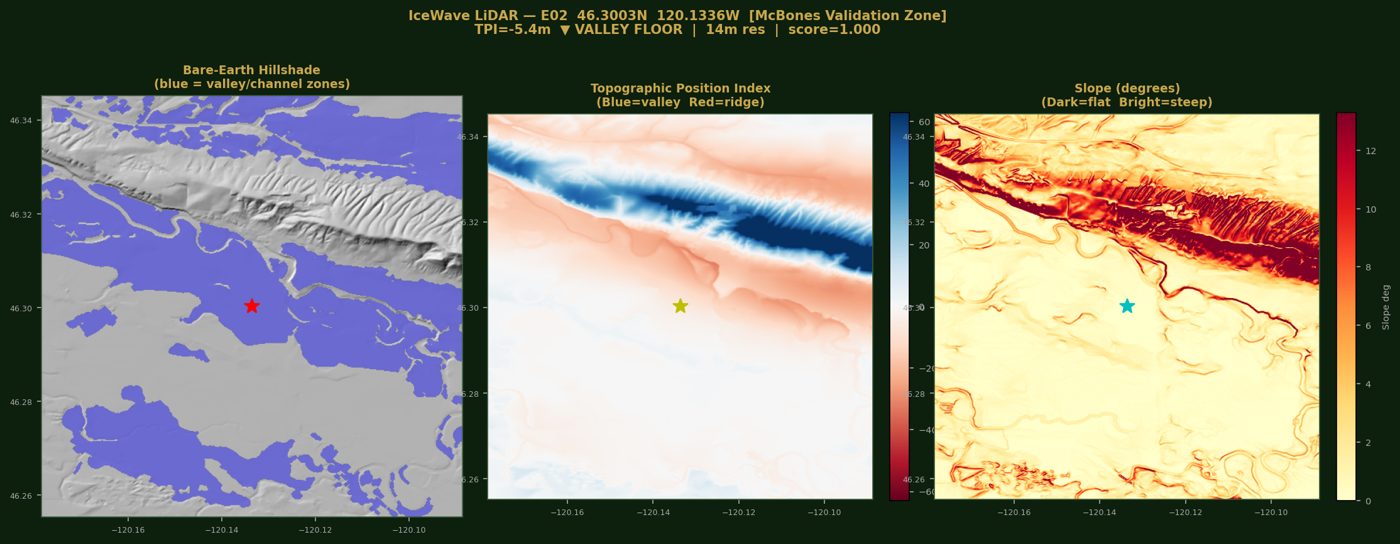
E02, the old “validated” target. The star sits on a patch of the elevation model that’s flat to within a centimetre for over a square kilometre. That’s how elevation models draw water.
Zeros looked like fossils
That patch is the real story. The 30 m elevation grid I sampled never reached Montana. So all 18 Montana fossil records, and 5 in Idaho, went into training with elevation, slope, aspect and ruggedness all exactly zero. Twenty-three of the forty. The model did what models do and learned the pattern: zeros mean fossils.
Out in the real landscape, the places where slope and ruggedness are exactly zero are water. Elevation models flatten lakes, reservoirs and wide rivers to a single level. So all six of the top east targets had all-zero terrain, and every zero-terrain target I had a close-up for sits on a patch the elevation model has flattened dead level, the way it draws a pond, a lake or a river. OpenStreetMap names some of them: Lake Bryan and Lower Granite Lake on the Snake River, Bear Lake near Spokane, Lake Wallula on the Columbia, and Waptus Lake, high in the Alpine Lakes Wilderness.
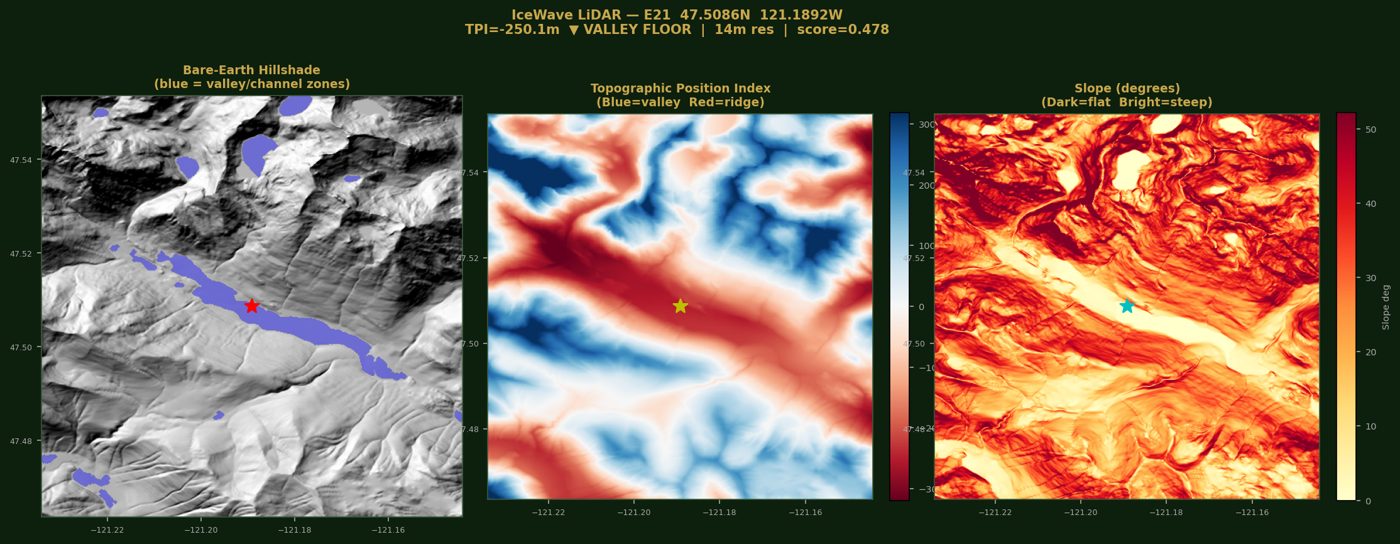
E21, which my old README called “the most extreme basin in the dataset.” It’s Waptus Lake, in the Alpine Lakes Wilderness. Lovely place for a swim; no Missoula flood ever reached it.
A label, not geology
What about 36 out of 40? The final model added a rock score from the geologic map: sand and silt scored high, basalt low. For the fossil records I looked the rock up. For the random background points I didn’t; every one of them got a default of 0.5. None of the forty fossil records happens to score 0.5, so “not 0.5” meant “fossil,” perfectly. The model’s own feature-importance chart gave the rock score 58% of the weight; I’d read that as geology mattering. The re-check reproduces the 36 of 40 (37, with today’s version of scikit-learn). Take the rock score out and test the honest way, leaving out whole places rather than single records, and the model can only find ten of the 28 places it hadn’t seen by also flagging 18% of random ground. Its AUC is 0.65, where a coin toss is 0.5. The west model had the same shortcut, and on terrain alone it manages 0.63.
Two smaller things turned up along the way. The “LiDAR” close-ups are USGS 3DEP elevation fetched at about 14 m, and the “13 of 20 valley floors” are mostly those same rivers and lakes, since a river is the bottom of its valley. And the east model’s “megafauna” included a gull, a chub, a horned lizard, a snapping turtle, a beaver and a pocket gopher, among others: 16 of the 40 records weren’t big animals at all.
What still holds
The idea does. The floods really did catch big animals and bury them in the Columbia Basin, and Coyote Canyon is a beautiful example; if you’re ever in the Tri-Cities, take the McBones tour. The fossil harvest across five states is real and reusable. And now IceWave has a page that tells the truth about itself: every target coloured by what’s actually there, the six checks laid out with the old claims struck through, and a weekly check of the Paleobiology Database that will say when someone records a new Ice Age find, and whether it’s near anything IceWave pointed at. The first check found 539 records at 69 places, the same count my notebook found when I built the model.
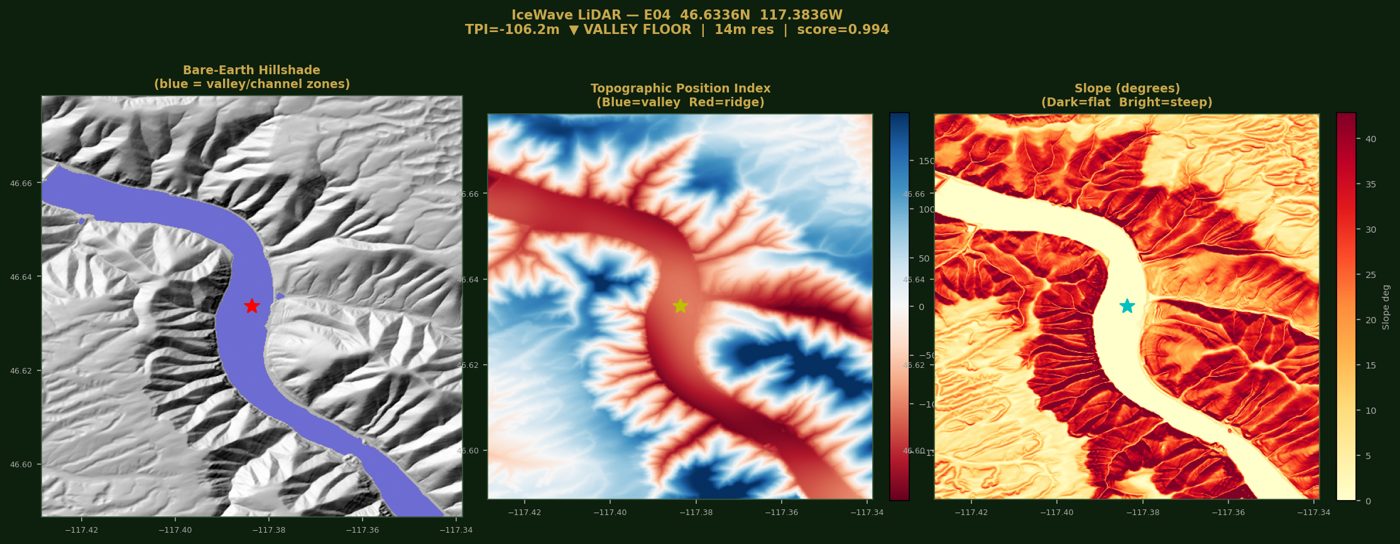
E04, the third-best east target: the middle of Lower Granite Lake, a reservoir on the Snake River. One more correction: the middle panel says “blue = valley,” but its colours run the other way round.
What’s next
IceWave needs rebuilding, not tuning. Measure every input the same way at fossil sites and at background points. Mask out water before scoring anything. Train on the animals I actually want to find. Test by leaving out whole places. Then score the whole landscape and see where places the model has never seen, like Coyote Canyon, land on it. That’s a winter project.
I’ll be honest: writing “none of it survives” about my own work stung a bit. But the version of IceWave that knows it found rivers is worth more than the one that thought it had found a mammoth. And now I know exactly what to fix.
Code, notebooks and every number: github.com/bdgroves/project-ice-wave. Fossil records from the Paleobiology Database and iDigBio; elevation from USGS 3DEP; geology from the USGS State Geologic Map Compilation; water names © OpenStreetMap contributors.
Go deeper
Mystery of the Megaflood — NOVA (PBS), 20 September 2005, an hour-long program. The story of J Harlen Bretz, the scablands and Glacial Lake Missoula; the companion site has maps and an interview with Vic Baker.
Ice Age Floods Animation — Ice Age Floods National Geologic Trail (National Park Service), updated 15 January 2026, about 3.5 min video. Watch the ice dam fail and the water race across four states.
Bretz, J.H. (1923). The Channeled Scablands of the Columbia Plateau. The Journal of Geology 31(8), 617–649.
Waitt, R.B. Jr. (1985). Case for periodic, colossal jökulhlaups from Pleistocene glacial Lake Missoula. Geological Society of America Bulletin 96(10), 1271–1286.
O’Connor, J.E., Baker, V.R., Waitt, R.B., Smith, L.N., Cannon, C.M., George, D.L. & Denlinger, R.P. (2020). The Missoula and Bonneville floods — A review of ice-age megafloods in the Columbia River basin. Earth-Science Reviews 208, 103181.
Waters, M.R., Stafford, T.W. Jr., McDonald, H.G., Gustafson, C., Rasmussen, M., Cappellini, E., Olsen, J.V., Szklarczyk, D., Jensen, L.J., Gilbert, M.T.P. & Willerslev, E. (2011). Pre-Clovis mastodon hunting 13,800 years ago at the Manis site, Washington. Science 334(6054), 351–353.
Roberts, D.R., Bahn, V., Ciuti, S., Boyce, M.S., Elith, J., Guillera-Arroita, G., Hauenstein, S., Lahoz-Monfort, J.J., Schröder, B., Thuiller, W., Warton, D.I., Wintle, B.A., Hartig, F. & Dormann, C.F. (2017). Cross-validation strategies for data with temporal, spatial, hierarchical, or phylogenetic structure. Ecography 40(8), 913–929.
The World’s Largest Floods, Past and Present: Their Causes and Magnitudes — Jim O’Connor & John Costa, USGS Circular 1254; Lake Missoula in good company, free to read.
Emanuel Manis Finds Mastodon Tusks in Sequim on August 8, 1977 — Laura Arksey, HistoryLink, 2008; the backhoe-pond find, told well.
Paleobiology Database — the fossil records, checked weekly. · iDigBio — museum specimen records. · USGS 3DEP — the elevation. · USGS State Geologic Map Compilation — the geology.
Ice Age Floods National Geologic Trail — places to see the floods’ work for yourself. · McBones Research Center — Coyote Canyon digs and tours. · Wenas Creek Mammoth Project — Central Washington University. · Burke Museum — where to report a find.
IceWave — the live page, pits and all. · project-ice-wave — this project’s code and the re-check script.