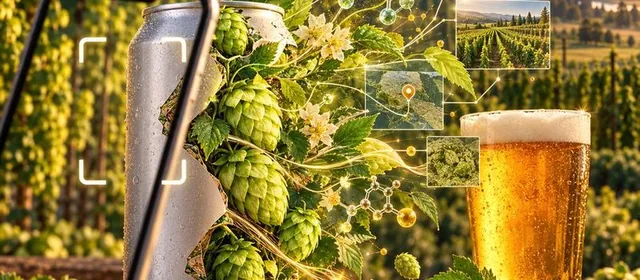
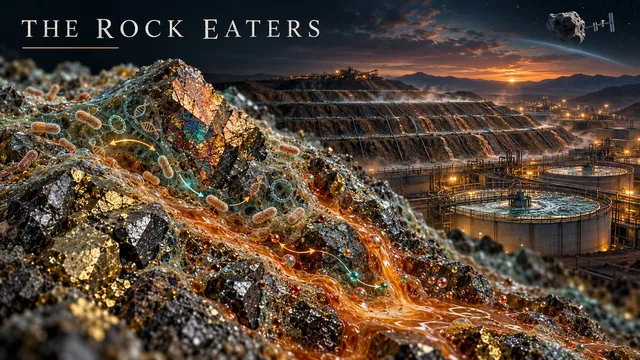
Oct 20, 2026In 1996 I worked with Doug Rawlings in Cape Town on bacteria that eat iron and sulfur. Thirty years later those rock eaters pull copper, nickel and gold from rock on four continents, leach rare earths on the space station, and may yet turn mine waste back into ore. Here is how they work, how far they have come, and the pioneer who helped start it.
 Oct 17, 2026
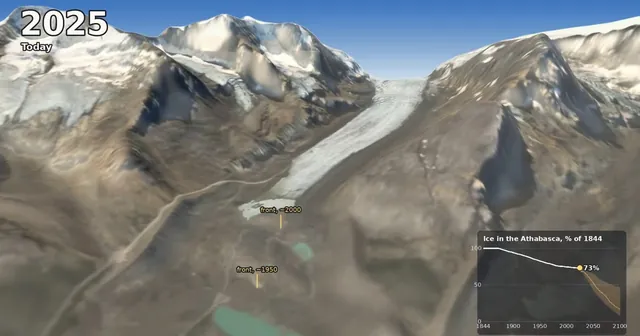
A 75-second forge3d film from the Icefield Centre lookout on the Icefields Parkway: the Athabasca Glacier from its 1844 Little Ice Age high stand to today, then on to 2100 with OGGM projections under three emissions scenarios, plus the Columbia Icefield, its three oceans and why the ice matters downstream.
 Oct 9, 2026
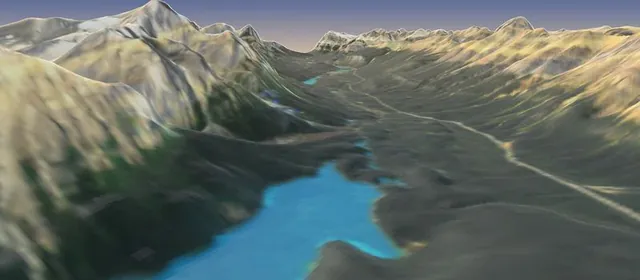
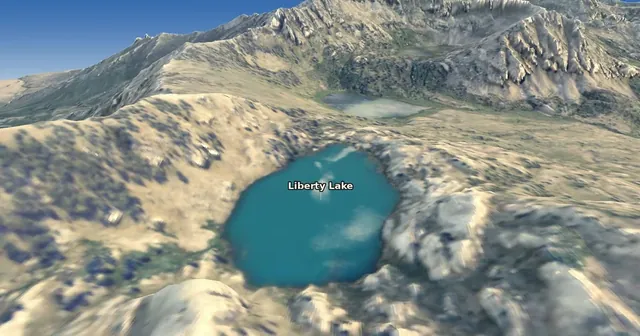
A two-and-a-half-minute forge3d flight on 1 m lidar up Lamoille Canyon in Nevada’s Ruby Mountains, over Liberty Pass to Liberty Lake on the Ruby Crest Trail I fastpacked back around 2014, with the glaciers that carved the canyon, rocks hauled up from 35 km down, and the only wild Himalayan snowcocks in North America.
 Oct 6, 2026
A two-minute forge3d flight on 1 m lidar from Tioga Pass down Lee Vining Canyon, over Mono Lake, Negit and Paoha, past South Tufa and along the Mono Craters, with the geology, volcanoes, water and wildlife of the Mono Basin along the way.
 Oct 6, 2026
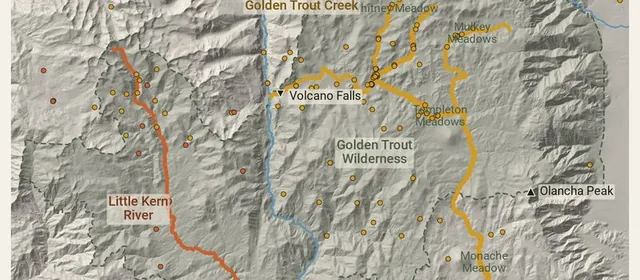
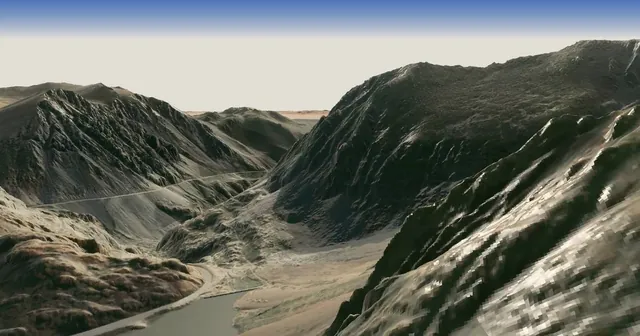
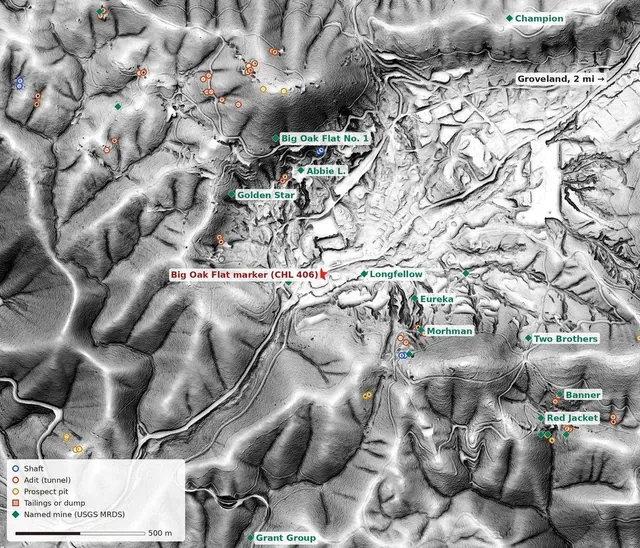
I grew up in Groveland, in a county where the hills are full of holes. So I counted them: 1,040 shafts, adits and prospect pits from the old USGS topo maps, laid over bare-earth lidar. Columbia’s limestone rock gardens, the flooded Harvard pit, and old tailings that now sit out on Don Pedro Reservoir.
 Oct 5, 2026
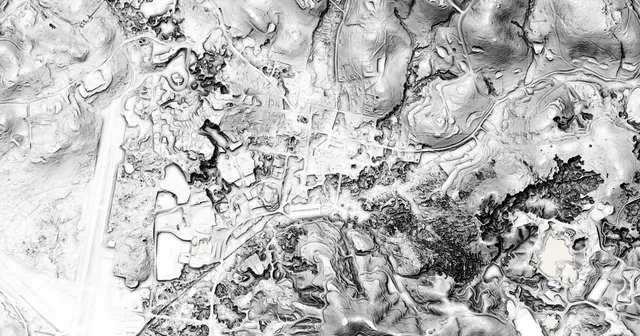
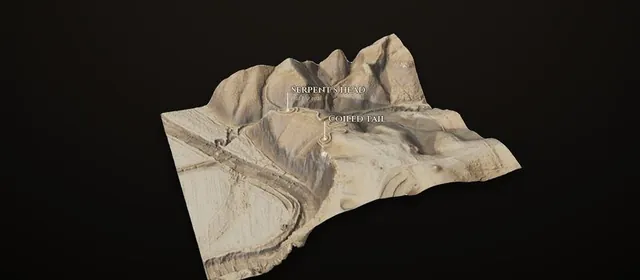
I rebuilt Project Kiva into an atlas of twelve archaeological places in bare-earth lidar, from Chaco Canyon to Cahokia, Serpent Mound, Poverty Point and two Wisconsin effigy mounds. Drag a line across the aerial photo to see the ground underneath, switch between five relief views, and turn each site in 3D with forge3d.
 Oct 5, 2026
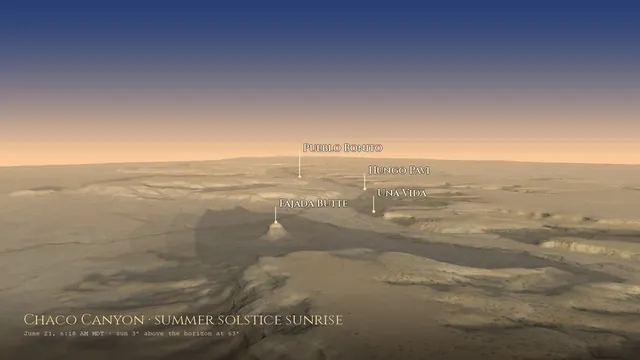
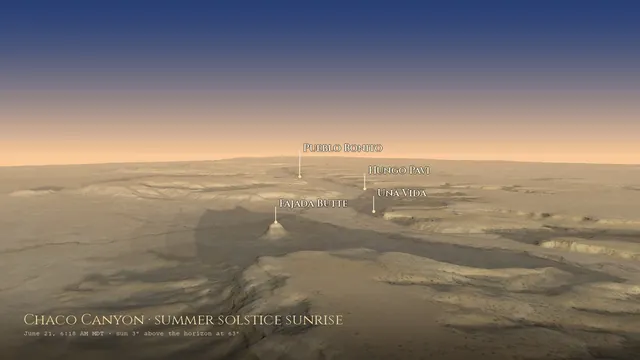
I came back to my Chaco Canyon sky page and rebuilt it around the real skyline: every sunrise of the year on each great house’s own horizon, a forge3d flight down the canyon at summer solstice dawn rendered with no graphics card, eleven sites moved to where they really are, and a few things I’d gotten wrong.
 Oct 4, 2026
I re-checked IceWave, my model of where Ice Age animals might be buried in the Northwest. Its “blind validation” at the Coyote Canyon mammoth dig was 69 km off, its top targets were rivers and reservoirs, and its 90% came from a default value. Here’s how that happened, and what still holds.
 Oct 4, 2026
I came back to my early model of where central Nevada’s Triassic ichthyosaurs might still be buried, gave it a page and a weekly check against the Paleobiology Database, and re-checked its numbers. It knew 18 places, not 30, and less than it claimed. Here’s what still holds, and fifty places to go and look.
 Oct 2, 2026
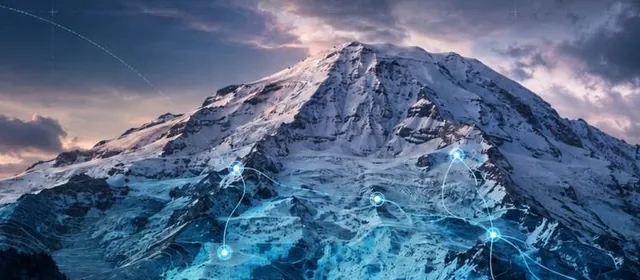
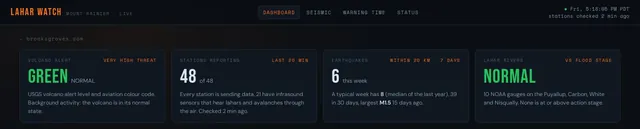
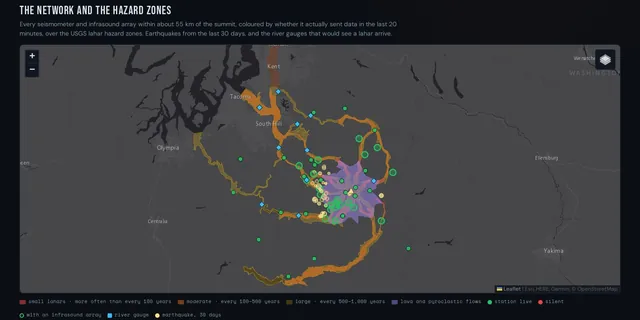
My Mount Rainier lahar dashboard was mostly invented: a random-number seismogram, and stations that only had to exist to show green. Now it shows the real network, all 48 stations and whether each is reporting, the 2025 earthquake swarm, the rivers against flood stage, and the warning times the USGS has published.
 Oct 2, 2026
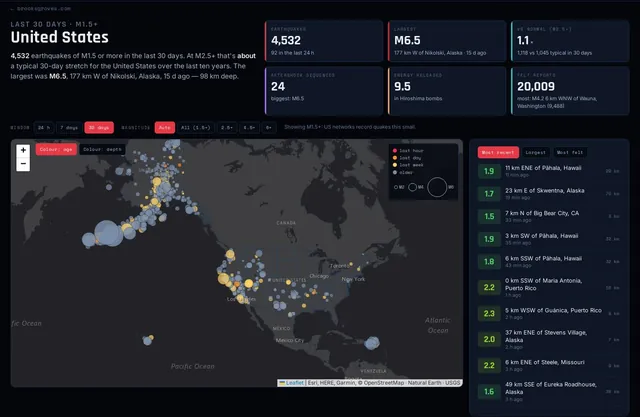
My earthquake dashboard gets a place picker for the US, any state, any country or region; fair comparisons at the magnitude each network actually catches; ten years of normal; real aftershock sequences; and the Texas quakes it had been filing under New Mexico.
 Oct 1, 2026
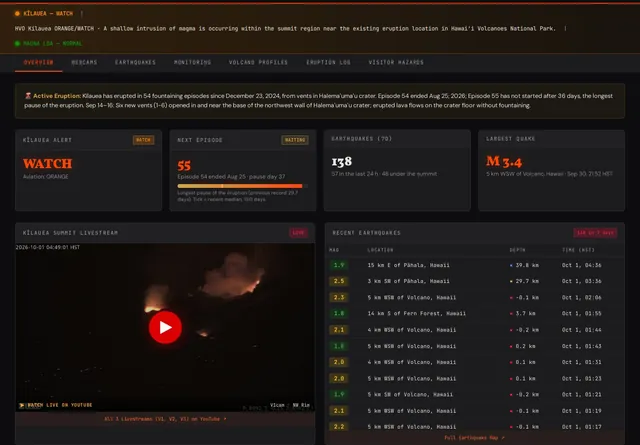
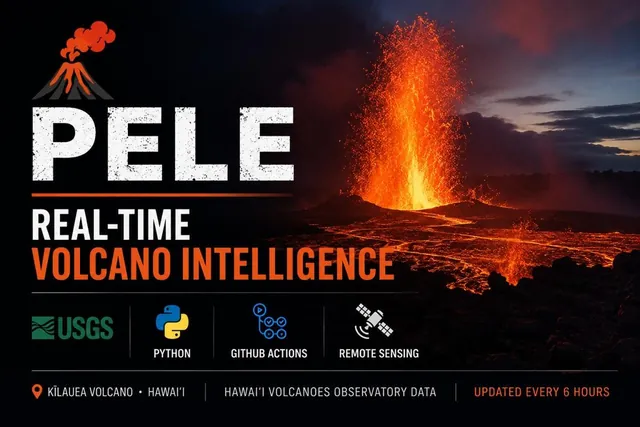
Six months after I built PELE, Kīlauea stopped keeping time: 54 episodes, then the longest pause of the eruption and a shallow intrusion under the summit. What the dashboard got wrong (it was hiding the swarm), what the episode table shows, and how it now reads tilt, quakes and webcams live.
 Sep 20, 2026
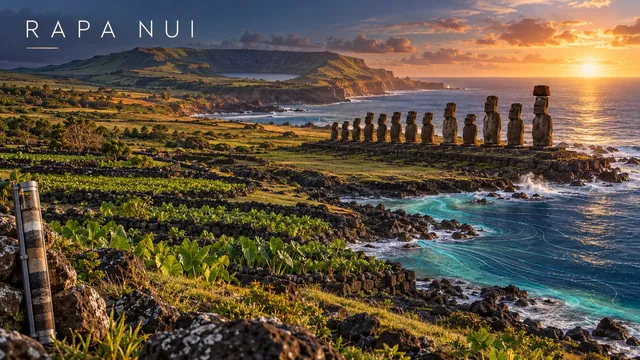
The Jared Diamond ecocide story — a civilization cutting down its own trees and starving itself — is a hell of a parable and mostly wrong. Three independent lines of evidence converged on Rapa Nui in the last two years: shortwave infrared satellite imagery and machine learning mapping every lithic-mulch rock garden on the island, pointing to a population ceiling nearer 3,000 than 15,000 (a finding that is genuinely contested, and flagged as such); 800 years of rainfall read out of hydrogen isotopes in lake sediment, showing a real drought the Rapanui adapted to rather than collapsed under; and a conductivity meter walked along the coastline, which found fresh water at every single ahu. The actual collapse has a date and a cause, and it is not the Rapanui.
 April 2026
The first build: a live dashboard watching the same sky over Chaco Canyon that its builders watched. Rebuilt in October 2026, with corrections; see SOLSTICE, Revisited.
 April 2026
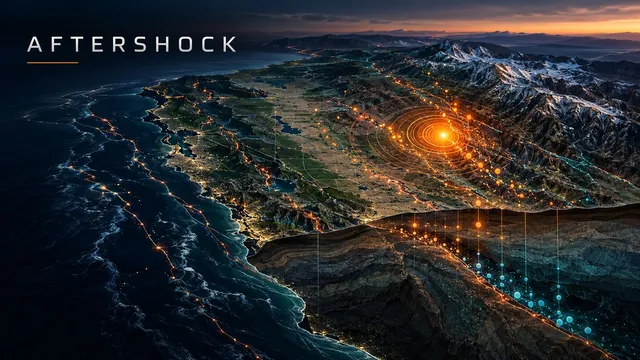
Growing up on the Melones Fault Zone. Loma Prieta 1989. A live seismic dashboard from USGS and GitHub Actions.
 Apr 5, 2026
43 eruption episodes, a buried webcam, and a cron job. Real data from USGS HVO, six times a day.
 2026
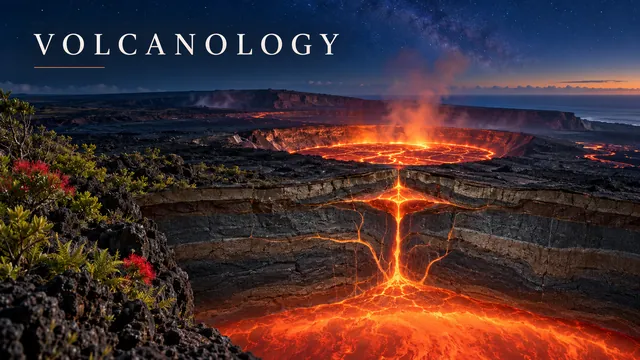
16 lessons on plate tectonics, magma, eruption types, Kilauea, the Cascades, and supervolcanoes.
No posts with that tag.
 🌋 lahar-watch
 ⛏️ Mother Lode