An airplane flies over with a laser, firing a few hundred thousand pulses a second. Some of those pulses slip between the leaves, past the roofs and the parked cars, and hit the dirt. Keep only the ones that reached the ground and you get the shape of the land with everything on top of it deleted. That's where old walls, mounds and ditches show up, sometimes ones nobody has stood next to in a thousand years.
Project Kiva is my corner for that. I came back to it this week with everything forge3d has taught me lately and rebuilt it into an atlas of ten places, from Chaco Canyon to Cahokia. On the page you drag a line across the aerial photo and the ground underneath appears.
Serpent Mound, Ohio · 2.3 million ground returns at half a metre · USGS 3DEP lidar · rendered with forge3d 1.40.1
New Mexico to Ohio
at the ground
height, all 411 m of it
for nine of them
The ten places
- Pueblo Bonito, Chaco Canyon. The great houses of the canyon floor, from a 2024 lidar tile that fills a hole in the usual USGS elevation map right over the canyon.
- Aztec Ruins, Far View and Chimney Rock. A Chacoan great house on the Animas River, the mesa-top villages above Mesa Verde's cliff dwellings, and a great house on a knife-edge ridge beside two rock pinnacles.
- Pueblo Grande. A Hohokam platform mound and ball court in the middle of Phoenix, between the freeways.
- Cahokia, Serpent Mound, Newark and Poverty Point. The great earthworks of the Mississippi and Ohio valleys: Monks Mound, a serpent effigy, a perfect octagon and circle built 2,000 years ago, and six concentric ridges older than that.
- Fort Steilacoom. Close to home in Lakewood: the field boundaries and old tracks of the 1849 Army post, still under the grass.
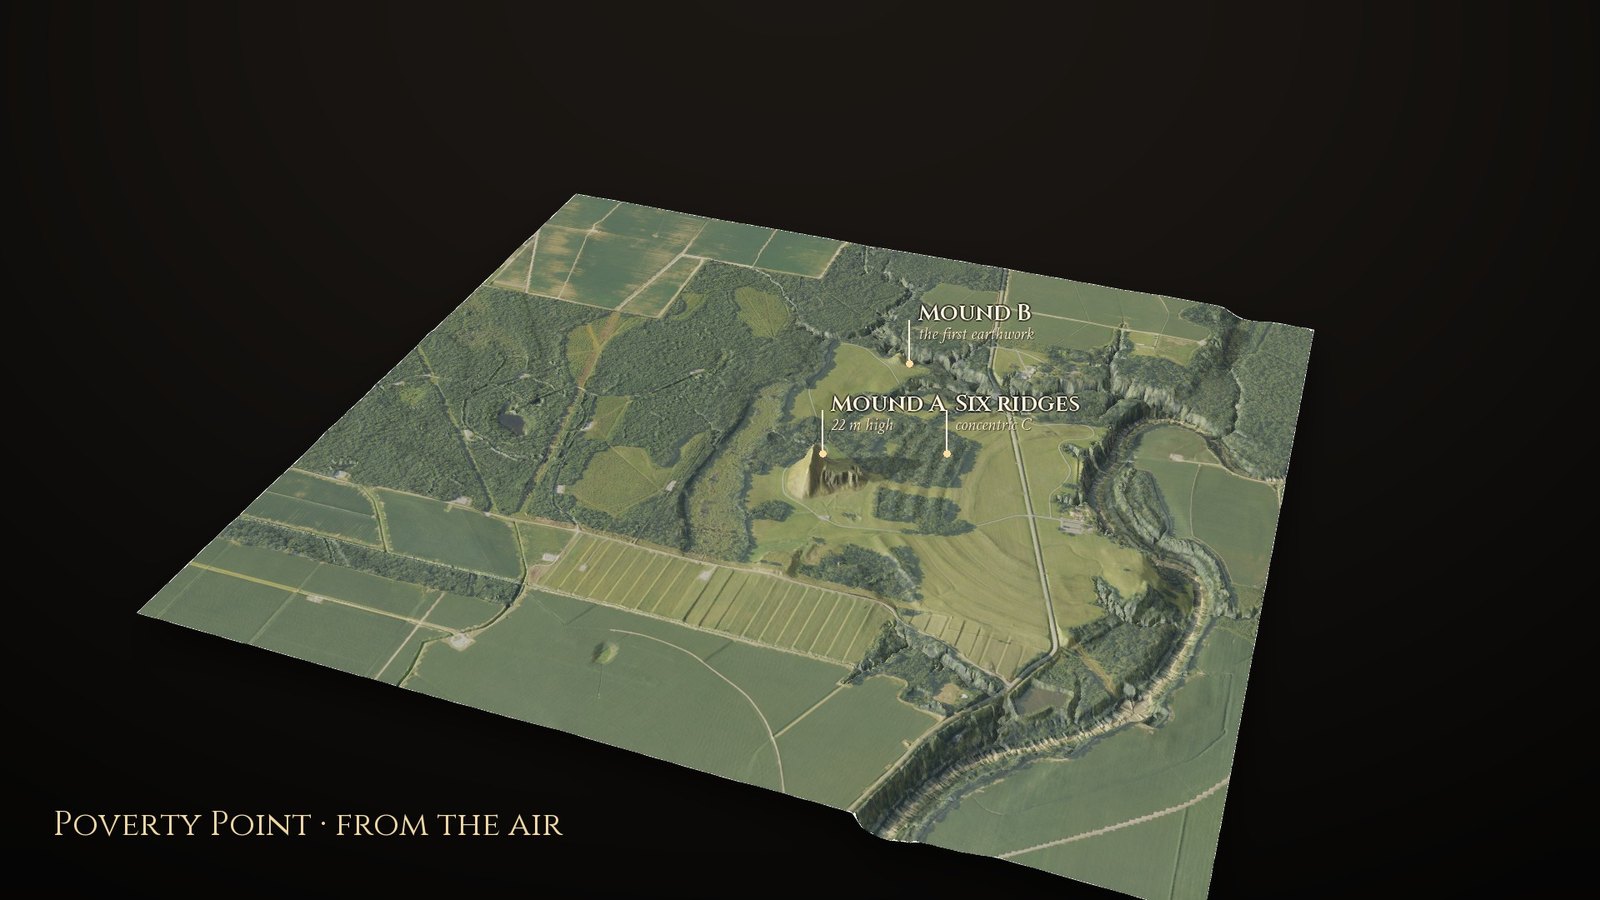
Poverty Point from the air: fields, woods and Bayou Maçon.
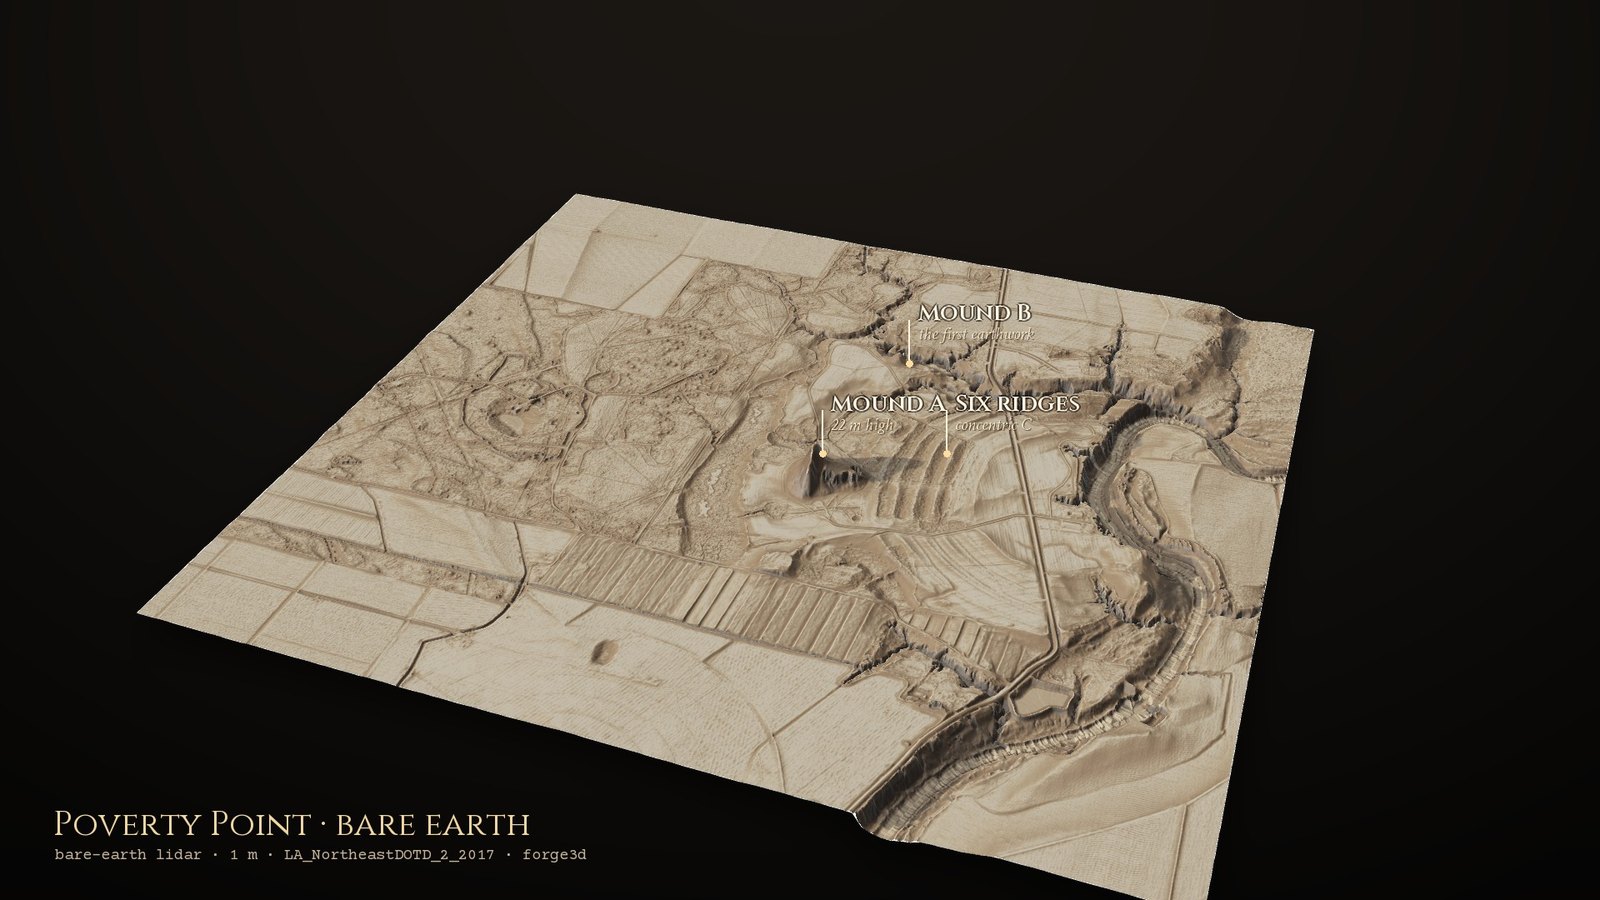
Same camera, bare earth: the six concentric ridges and Mound A, built about 1700–1100 BCE.
Five ways to look at the ground
The hard part isn't getting the ground; it's seeing the small things on it. A wall a metre high is invisible next to a canyon a hundred metres deep, because ordinary shading is all about the big shapes. So archaeologists have come up with ways to strip the big shapes away, and the atlas has five of them:
- Local relief. Blur the ground and subtract the blur from the original. Hills and canyons cancel out, and only the small bumps and hollows are left: warm for walls and mounds, blue for rooms and ditches.
- Sky view. How much of the sky each spot can see. A ditch or a sunken room sees less sky and goes dark.
- Openness. The same idea read the other way up, so hollows glow. Good for finding kivas.
- Hillshade from sixteen suns. A wall that lines up with the light disappears in ordinary shading, so this one lights the ground from all around at once.
- The composite. A blend of several of these that archaeologists use as an all-purpose first look. It's the default on the page and the texture on the 3D blocks.
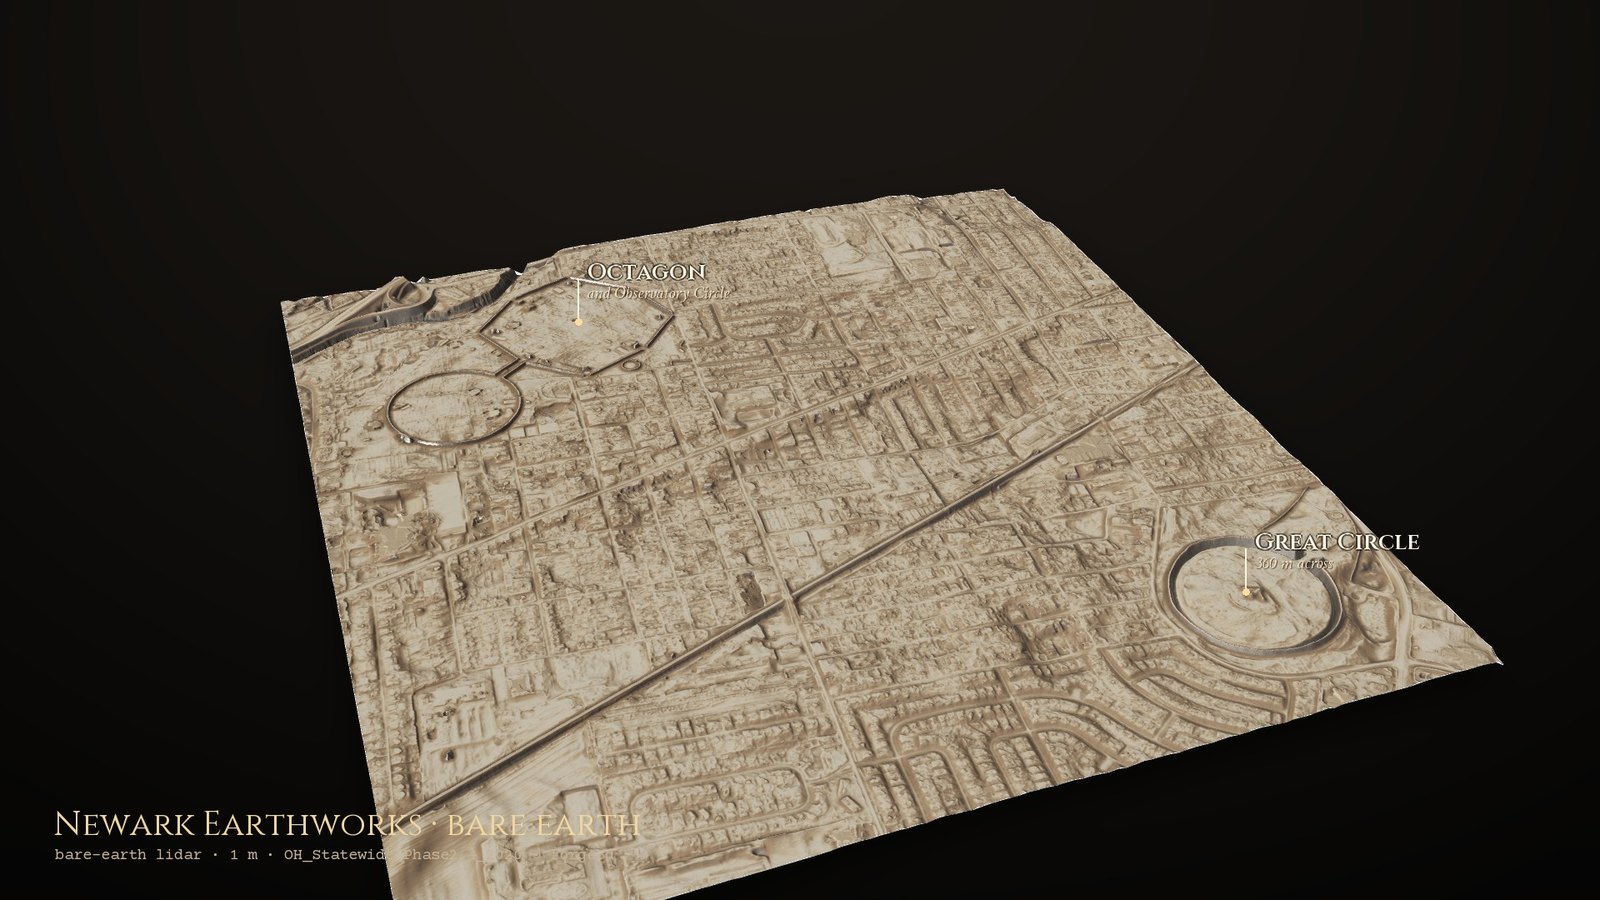
Newark, Ohio: the Octagon and its circle (left) and the Great Circle (right), built by the Hopewell culture about 2,000 years ago, among the city's streets.
No downloads, and no graphics card
The whole USGS lidar archive, about 75 trillion points, sits on Amazon's cloud in a format you can read a window at a time. For nine of the ten places the code asks for just the points inside a rectangle, keeps the ground, and builds the surface, without ever downloading a survey. Chaco's tiles aren't in that archive yet, so for Pueblo Bonito it downloads nine tiles from The National Map instead.
Then forge3d turns each one into a block of ground, like a museum specimen. The relief composite is draped over the terrain, and the light comes in low from the northwest, the raking light archaeologists wait for. Like the SOLSTICE flyover, it all runs on GitHub's computers with a software graphics driver, ten sites side by side.
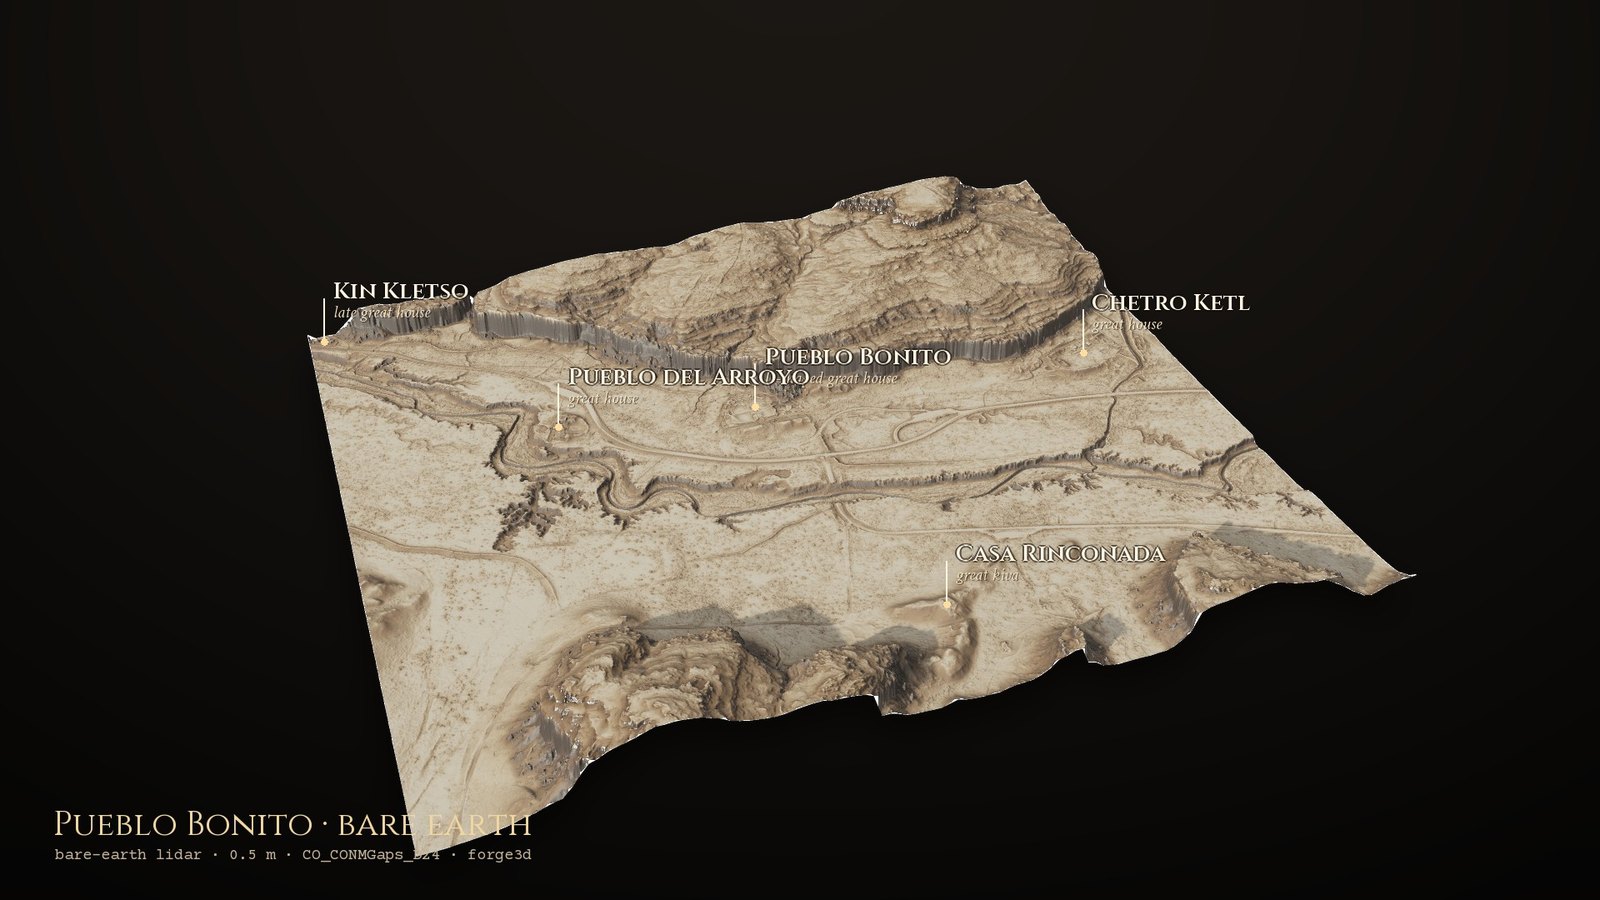
Pueblo Bonito and its neighbours on the floor of Chaco Canyon, at half a metre.
What changed
The first version of Project Kiva was mostly my notebook: some great field notes, a few flythroughs, and a map I'd meant to come back to. Coming back to it, a few things needed care:
- The map pins moved. Some of the Chaco great houses were a few hundred metres off, and a couple were kilometres off, the same mistake I'd found in SOLSTICE. Every pin now comes from finding the feature in the lidar itself.
- The placeholders are gone. The old map had some stand-in "candidate" points and sketched road lines that I'd always meant to replace with real ones. Now everything on it comes from real data.
- It runs anywhere. The old scripts only ran on my laptop. Now it's one Python package that runs on Windows or Linux with pixi, and on GitHub.
- The things I meant to build got built. Sky view, openness and the multi-sun hillshade were on the old to-do list.
A few checks that worked
I like it best when the data checks itself. The highest point in the Cahokia window lands on top of Monks Mound. Mesa Verde's Mummy Lake, found as a ring in the lidar, sits within a few metres of its published location. Poverty Point's two biggest mounds come out 611 metres apart, against a published 625. And at Chimney Rock the highest point in the window is 2,409 metres, the top of the pinnacle itself.
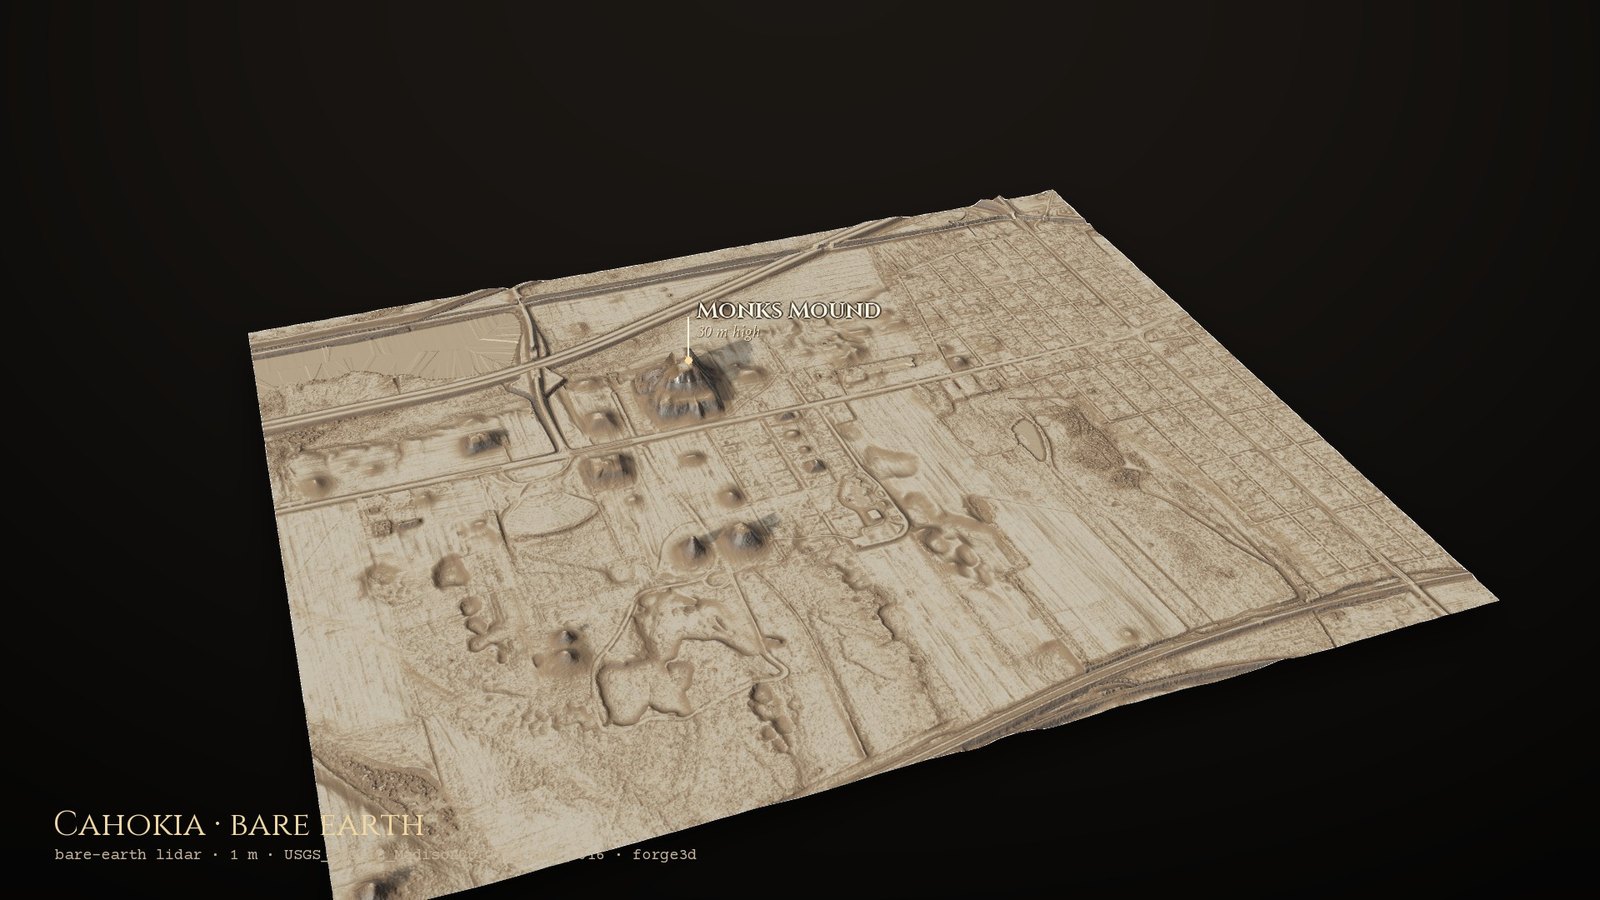
Cahokia: Monks Mound and the mounds around it, with the interstate across the top.
Update: two from Wisconsin
The day after this went up, a couple of posts from @lidar.america sent me to Wisconsin, home of the effigy mounds. Between about 700 and 1100 CE, Late Woodland people there built thousands of low earthen mounds, many shaped like birds, bears, panthers and other animals, a tradition found almost nowhere else. Under the trees they're easy to walk right past, and that's exactly where lidar shines. So the atlas now has two more:
- Devil's Lake Birdman. A winged figure spread across the south shore of Devil's Lake, about 65 metres from wingtip to wingtip, read as a bird, a thunderbird or a person with wings. The Ho-Chunk, whose ancestors built the mounds, still hold the lake and its mounds sacred.
- Heim Fox Mound. A fox or wolf about 30 metres long, lying intact between the houses of a Middleton neighbourhood near Lake Mendota. The landowner, Ferdinand Heim, gave it to the Wisconsin Archeological Society in 1937, and they still look after it.
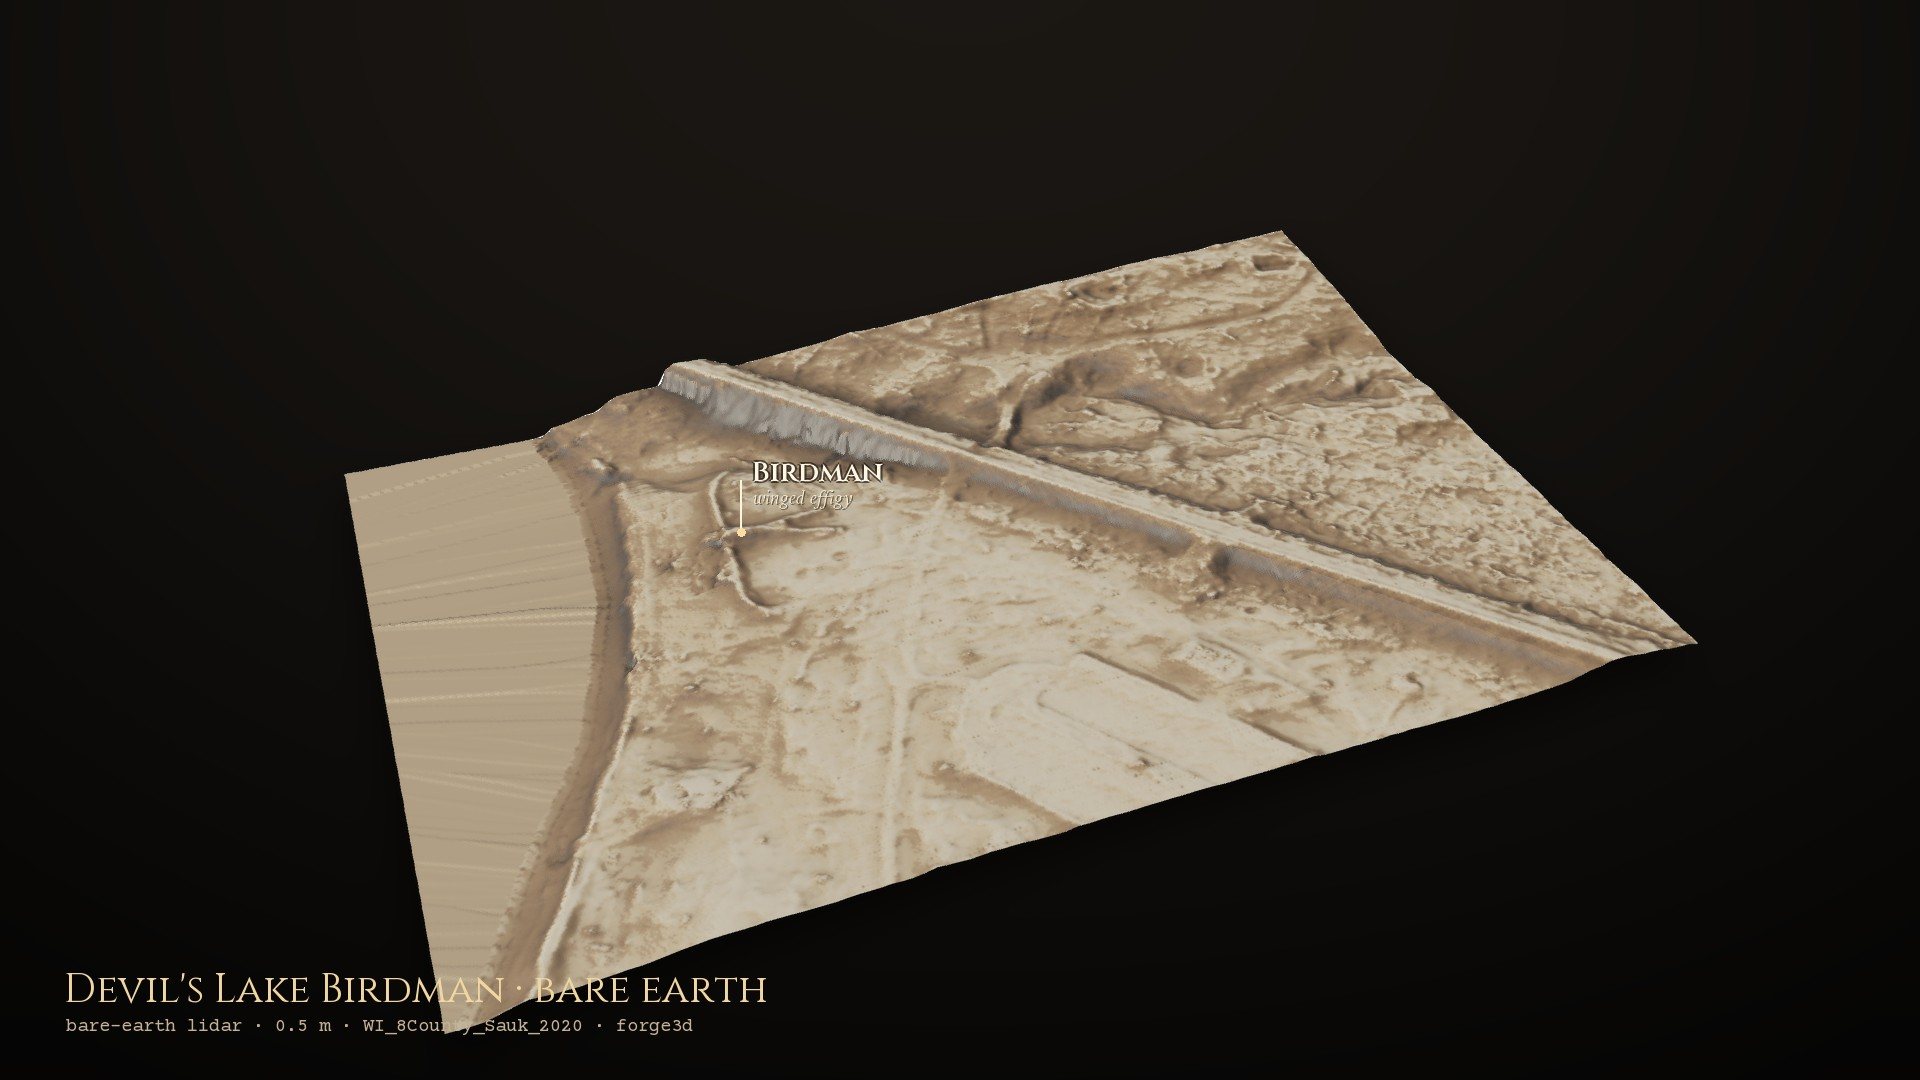
The Devil's Lake Birdman, with the lake to the left and the railway behind. Open it in the atlas.
While I was in there, I gave every place in the atlas a short “About the place” note: who built it, when, what's special about it, with links to Wikipedia, the park service or the site itself. I knew these places mostly as lidar, and it turns out the stories are every bit as good as the shapes.
Last thing
A bump in the ground is a question, not a find, and every place in the atlas is already well known and well studied; this is about seeing them, not discovering them. Several of them are sacred to living Native nations, and the best way to see them is still in person, on the trails, with respect.
Thanks again to Milos Popovic for forge3d, which keeps opening doors.
The atlas is at brooksgroves.com/project-kiva, and the code and field notes are at github.com/bdgroves/project-kiva.
Data: USGS 3D Elevation Program point clouds (AWS open data and The National Map); USDA NAIP aerial photography via Microsoft Planetary Computer. Rendering: forge3d 1.40.1 by Milos Popovic. Point processing: PDAL. Relief methods after Hesse (2010), Zakšek et al. (2011), Yokoyama et al. (2002) and Kokalj & Somrak (2019).
Go deeper
Descendants of Cahokia — Overheard at National Geographic, 7 December 2021, about 30 min. Tim Pauketat on the city’s rise, and Osage preservation officer Andrea Hunter on caring for the mounds today.
Conflicting Stories About the Serpent Mound — WYSO Curious, 26 December 2014, about 4½ min. Bill Romain and Brad Lepper on how old the serpent really is.
The Remarkable Earthworks and People of Poverty Point — The Mississippi Valley Traveler Podcast, episode 14, 22 February 2023, about an hour. Station archaeologist Diana Greenlee on the ridges, Mound A and the people who built them.
New Perspective on Wisconsin’s Monumental Earthworks — University Place, PBS Wisconsin, 4 June 2019, 41 min video. Amy Rosebrough of the Wisconsin Historical Society on finding effigy mounds under the trees with lidar.
Chase, A.F., Chase, D.Z., Fisher, C.T., Leisz, S.J. & Weishampel, J.F. (2012). Geospatial revolution and remote sensing LiDAR in Mesoamerican archaeology. Proceedings of the National Academy of Sciences 109, 12916–12921. Free to read.
Field, S. (2023). Lidar-derived road profiles: a case study using Chaco roads from the US Southwest. Advances in Archaeological Practice 11, 184–197. Open access.
Herrmann, E.W., Monaghan, G.W., Romain, W.F., Schilling, T.M., Burks, J., Leone, K.L., Purtill, M.P. & Tonetti, A. (2014). A new multistage construction chronology for the Great Serpent Mound, USA. Journal of Archaeological Science 50, 117–125.
Ortmann, A.L. (2010). Placing the Poverty Point mounds in their temporal context. American Antiquity 75, 657–678.
Kokalj, Ž. & Somrak, M. (2019). Why not a single image? Combining visualizations to facilitate fieldwork and on-screen mapping. Remote Sensing 11, 747. Open access.
Interpreting Archaeological Topography — Opitz & Cowley’s 2013 book, a friendly deep dive into reading lidar landscapes.
Indian Mounds of Wisconsin — Birmingham & Rosebrough’s second edition (2017), the effigy-mound story, free to read online.
Cahokia: Ancient America’s Great City on the Mississippi — Timothy Pauketat’s very readable book on the city around Monks Mound.
USGS 3D Elevation Program — the lidar behind every place in the atlas. · 3DEP point clouds on AWS — the cloud copy, read a window at a time. · The National Map Downloader — where Chaco’s tiles came from. · OpenTopography — free lidar and tools to explore it. · NAIP — USDA aerial photography, the “before” side of the slider.
UNESCO World Heritage: Chaco Culture · Cahokia Mounds · Monumental Earthworks of Poverty Point · Hopewell Ceremonial Earthworks (including Newark) · Serpent Mound (Tentative List)
Serpent Mound — Ohio History Connection, planning a visit. · Effigy Mounds National Monument — National Park Service, Iowa’s bear and bird mounds on the Mississippi. · forge3d — Milos Popovic’s renderer behind the 3D blocks. · Project Kiva — the atlas itself, twelve places and a slider.