Back in April I built Sentinel Stockpile, a little project that measures piles of cargo along the Columbia River from orbit: logs at a mill, wind-turbine blades on a dock, all from free European Space Agency imagery. I loved the idea of it. This fall I came back to it, found it broken in more ways than I expected, and rebuilt the whole thing. It now watches eight yards on its own (four at first, four more added the same day), twice a week, and it has a live dashboard.
And the first thing the rebuilt version showed me was this:
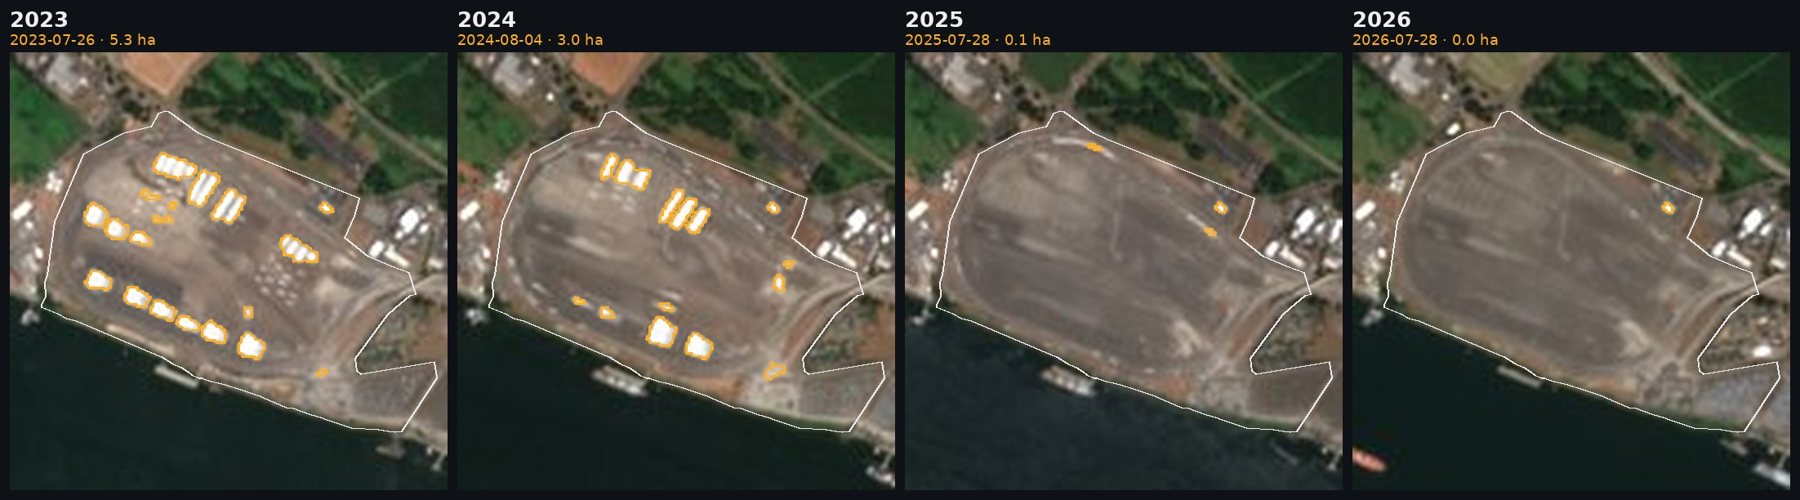
Terminal 5, Port of Vancouver USA, the wind-energy laydown yard, one clear midsummer day a year. Orange outlines are what the classifier calls blades. 5.3 ha in July 2023; next to nothing in 2025 and 2026.
That’s the Port of Vancouver’s Terminal 5, where wind-turbine blades come off the ships and wait for the trucks that carry them up the Columbia River Gorge. In the summer of 2023 there were rows of them across the yard, each white blob a rack of blades. By the summer of 2025 the yard was nearly empty, and it has stayed that way through 2026.
First, what I got wrong
I want to start with the honest part, because it changes the numbers from the first post. When I went back through the code, three things were wrong.
- Two of my four sites weren’t where I thought. My “Port of Vancouver” box was sitting on downtown Vancouver, about 5 km southeast of Terminal 5, and my Weyerhaeuser box was on downtown Longview. The wind numbers in the first version were measuring bright downtown rooftops, not blades. Every yard is now drawn from the real terminal outline in OpenStreetMap, and I checked each one against an aerial photo.
- The pixel values were off by a constant. Since early 2022, Sentinel-2’s processed images carry a +1000 offset in every band, which has to be subtracted. I never did, so ordinary pavement looked brighter than it is and my rules called anywhere from a quarter of a yard to all of it “stockpile” (Tacoma, every day).
- The automation had quietly stopped. The workflow had been failing since April, with three jobs racing each other to save their results, and GitHub had switched off the schedule for lack of activity.
None of that is fun to find, but it’s the reason to come back to old projects. So: new version, new numbers, and these ones I can show you how to check.
Teaching it what cargo looks like
Each Sentinel-2 pixel is 10 metres on a side, so the satellite never sees a log or a container, just patches of colour across six bands of light. The trick is that each kind of cargo has its own colour, so v3 has one rule per cargo instead of one rule for everything:
- Logs, lumber and wood chips are warm. Fresh wood and bark are much redder than they are blue; pavement and roofs are grey.
- Wind-turbine blades are bright, neutral white. Brighter than the yard around them, with no warm tint at all.
- Containers are painted, mostly in reds, oranges and browns, so a stack is warmer than the concrete around it. (Blue and white boxes slip through, so the Tacoma number tracks how full the stacks are rather than counting boxes.)
To set the rules I borrowed the USDA’s NAIP aerial photos, which are 0.6 m per pixel and were flown over these yards in the summer and fall of 2023. I picked out log decks, chip piles, blade racks, container rows and plain pavement on the photo, read off the satellite’s values for each one, set the thresholds between them, and then drew every pixel the rule picked on top of the photo to see what it got right.
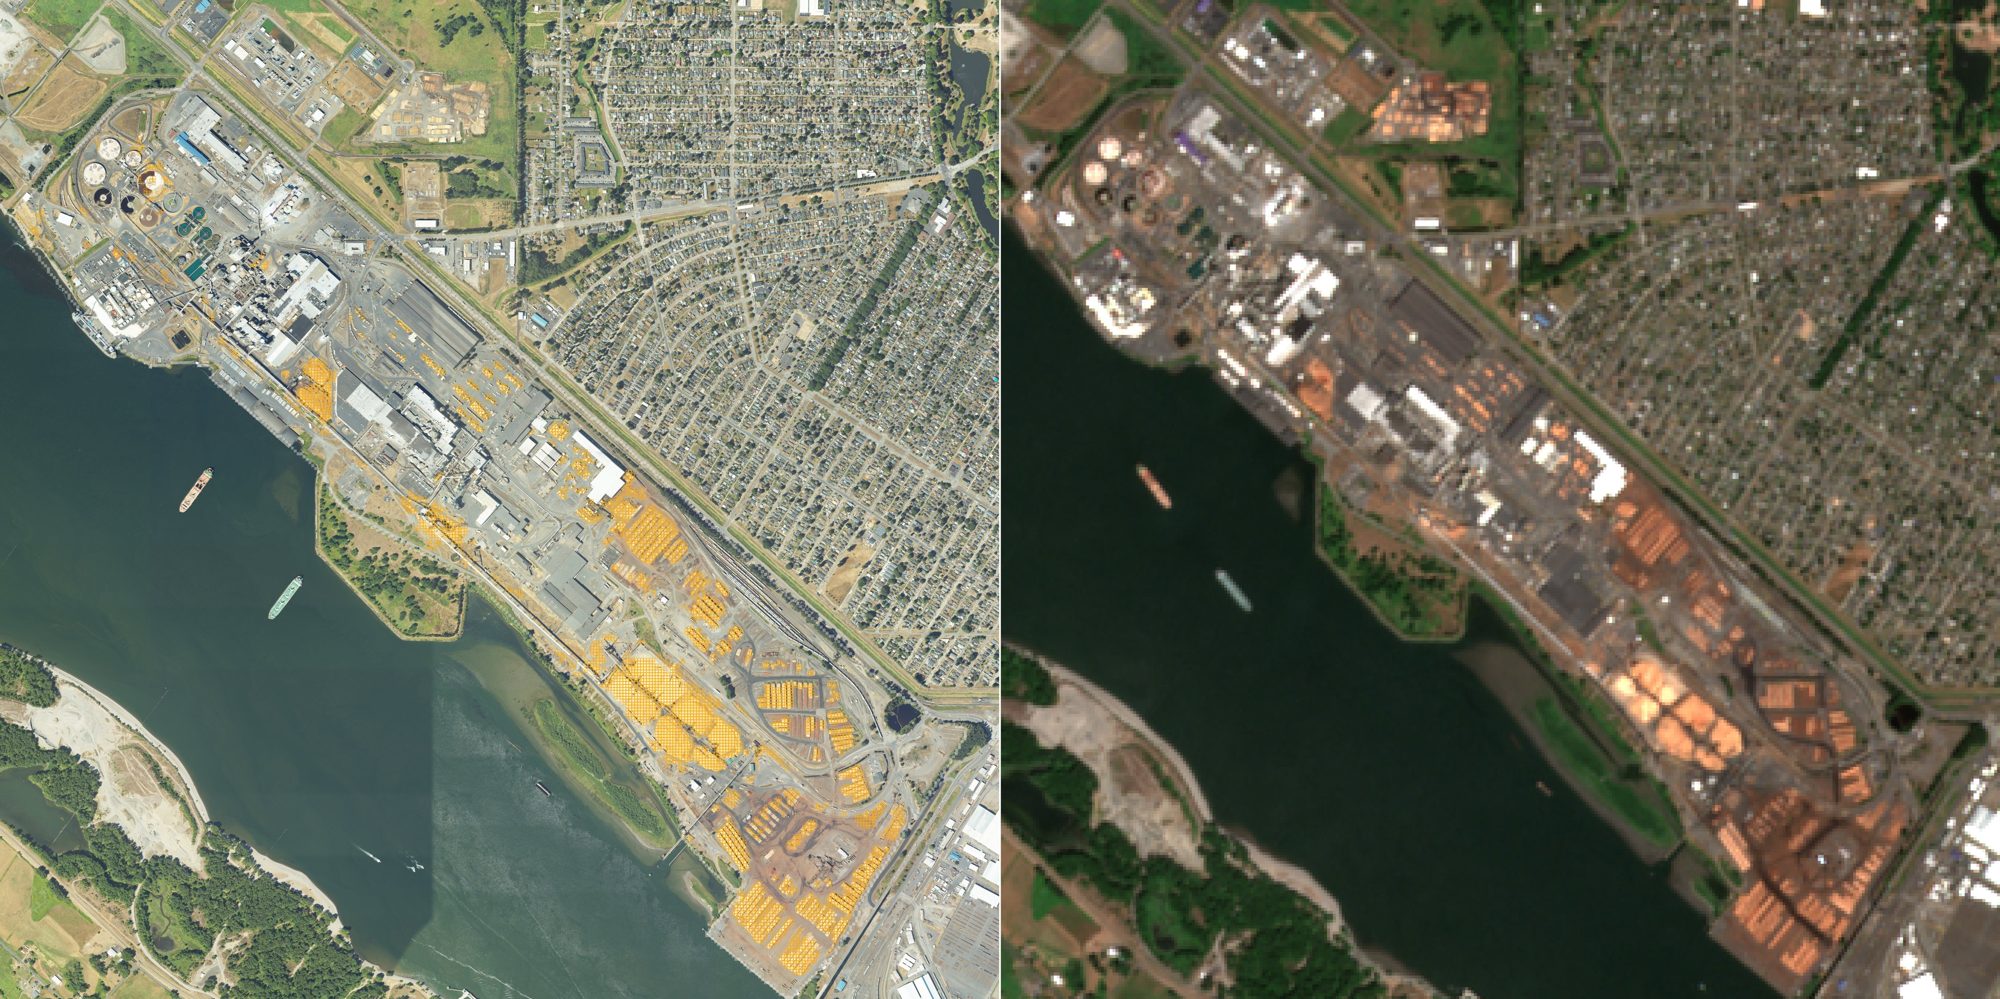
The check: the 1 August 2023 NAIP photo of Weyerhaeuser Longview with every 10 m pixel the lumber rule picks on the Sentinel-2 pass of 31 July outlined (left), and that Sentinel scene (right). Click to enlarge.
That check caught a few things I’d never have guessed. My favourite: in August, dry grass along the riverbank is the same colour as a log deck. A single summer image can’t tell them apart. But the grass gives itself away in spring, when it turns green, and logs never do. So v3 looks at every clear scene of the year, and any ground that’s properly green on a good share of them is never counted as cargo.
The check also turned up a surprise about the sites themselves. The Port of Longview, which I’d been tracking as a lumber port, turned out to be full of blade racks and steel inside the outline I was measuring; the big log decks were next door at Weyerhaeuser. So Longview now gets measured for blades too, which gave me two wind yards to compare.
Clouds, smoke and one snowy morning
This is the Pacific Northwest, so most of the work is throwing pictures away. Plainly overcast passes never even make the list. Of the ones that do, a scene only counts if Sentinel’s own cloud map shows the area around the yard nearly clear, and that still loses 40 to 58 percent of them depending on the site, at the worst rate in winter. A few more go later: scenes where the whole yard is much brighter in blue than usual (cloud the mask missed, or smoke; one hazy day in September 2024 tripped it at three of the four yards), and the January 2024 morning when snow covered Terminal 5 and the classifier, quite reasonably, decided most of the yard was one enormous wind blade.
What’s left is 135 to 177 clear looks at each yard since April 2023, about one every week or so.
Four summers
Here are the medians for June through September, from every clear pass:
Terminal 5
2023 → 2026
Port of Longview
2023 → 2026
summer 2026 vs
2023–25
Tacoma
2023 → 2024
Terminal 5 emptied out, and Longview more than halved. Terminal 5 went from 3.6 hectares of blades in a typical summer week in 2023 to 1.2 in 2024, 0.3 in 2025 and 0.1 this year. Longview, the other wind yard, shrank every summer too, from 5.9 hectares to 2.7. What the satellite can’t tell me is why. Wind projects run on long pipelines, and interest rates, supply chains and federal wind policy all shifted over these years. I’d like to dig into the shipping side of it next. (The wind rule picks up anything big, bright and neutral white, so strictly this is blades plus towers and any other white cargo; on the photos, it’s blades.) What it can tell me is that the blades stopped stacking up at Terminal 5, and that it started before 2025.
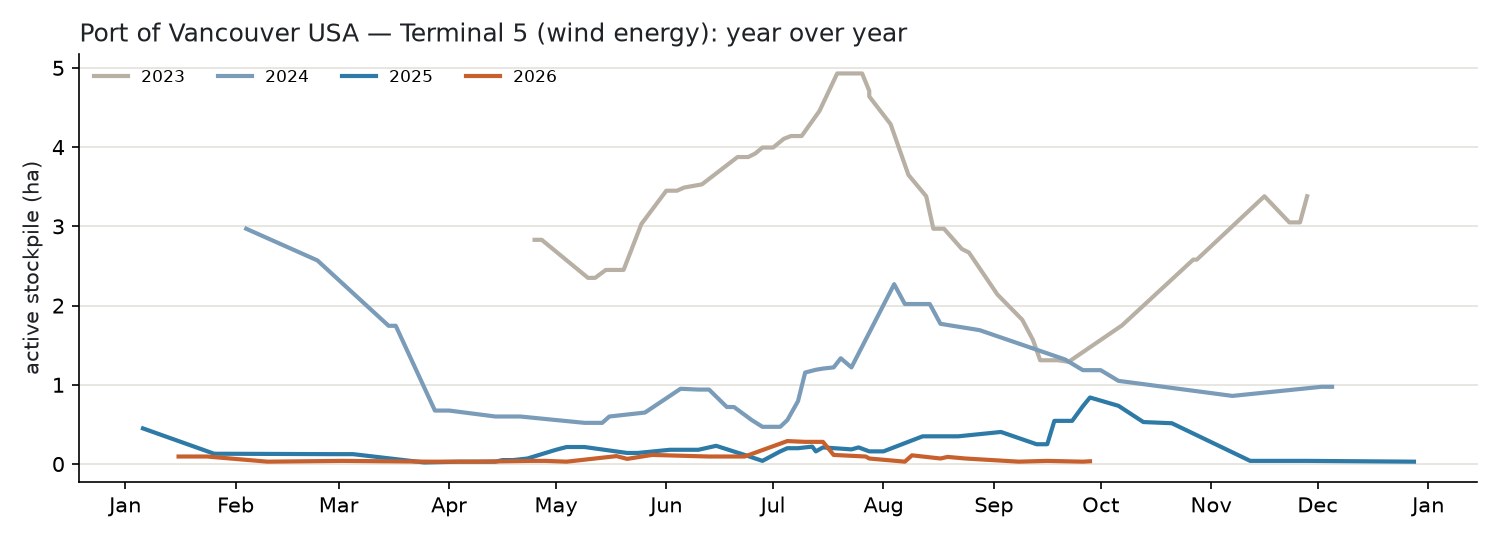
Terminal 5, year over year: a three-week running median of blade area, each year on one calendar.
The log yard’s summer is smaller this year. Weyerhaeuser’s decks and chip piles swell every summer and shrink every winter. Some of that winter dip is the wood itself (wet logs are darker than dry ones), so I only compare summers with summers. June through September of 2026 came in about a quarter below the three summers before it: 25 hectares against 32 to 34.
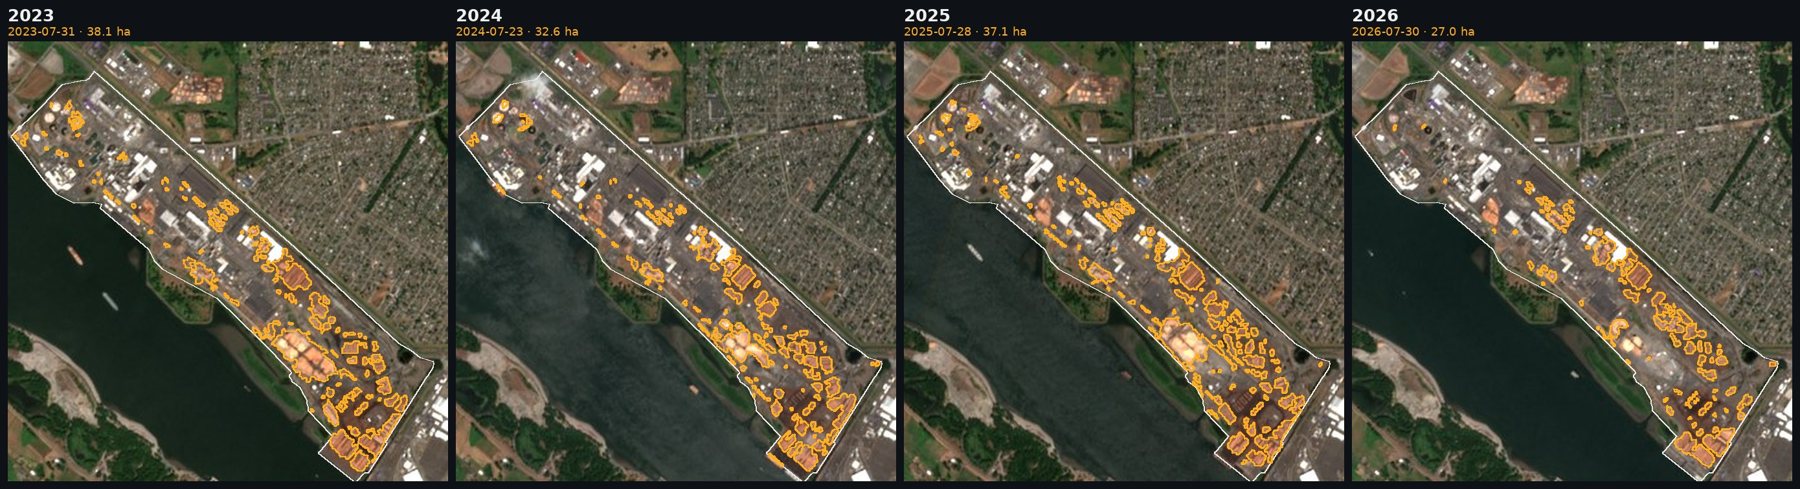
Weyerhaeuser Longview, one clear midsummer day a year, with the wood the classifier finds outlined.
Tacoma’s container stacks jumped in 2024 (total stack area here; a container yard has no “always-on” ground to subtract), from 7.4 to 12.8 hectares of a typical summer, and have eased since, to 11.4 last year and 9.1 this summer, still above 2023.
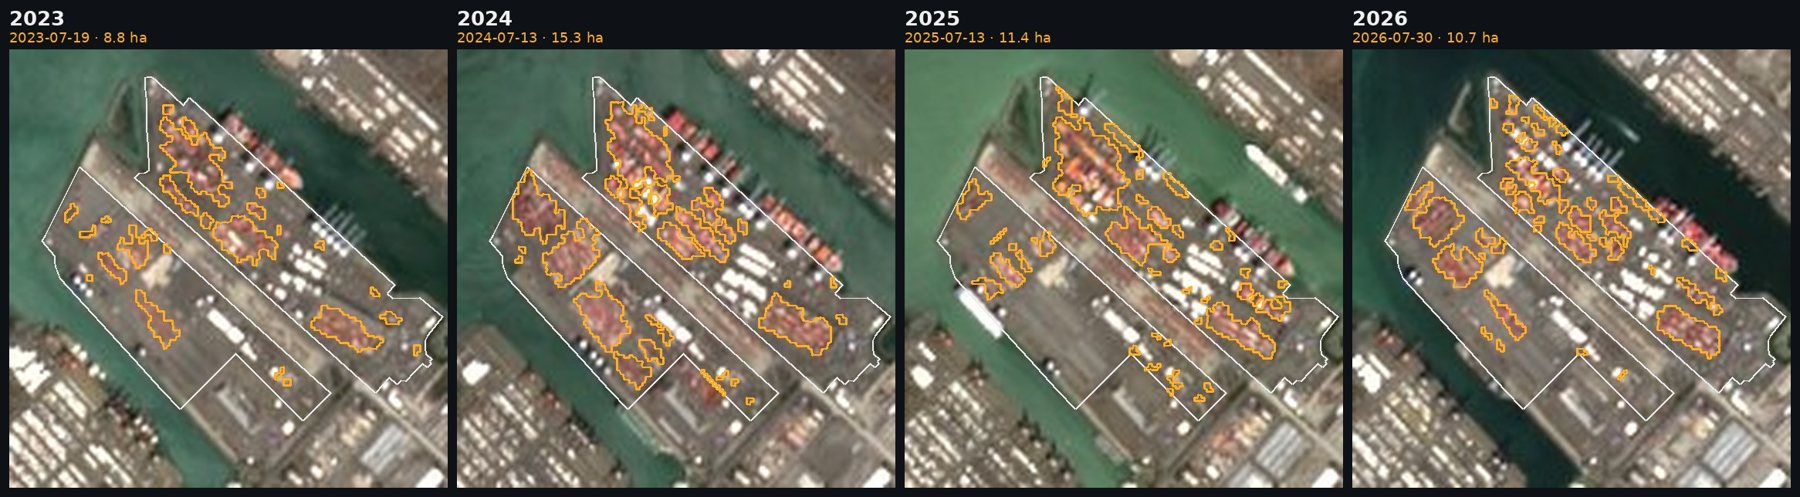
Port of Tacoma, Husky and East Sitcum terminals, with the container stacks the classifier finds outlined.
These are areas, not volumes. A stack twice as tall looks the same from above, and a single blade lying alone is only a few metres wide, narrower than a pixel. I think of the numbers as an index of how busy a yard is, and the year-over-year shape as the story.
Update: four more yards
Later the same day. Once the pipeline was running on its own, adding a yard turned out to be one small file and about a quarter of an hour of backfill, so I added four more: the Port of Grays Harbor’s Terminal 4 log yard in Aberdeen, Seattle’s Terminals 5 and 18, and Portland’s Terminal 6. Each one got the same treatment: an outline from OpenStreetMap, three years of clear passes, and a check of the classifier against the 2023 aerial photo. The dashboard now has eight tabs.
Grays Harbor’s big waterfront log deck is gone. In the summer of 2023 there were rows of export logs along the water at Terminal 4, about 7.8 hectares in a typical summer week. By 2024 that was down to 2.9, and in the 2025 and 2026 pictures the waterfront rows have vanished, leaving a smaller deck further inland. (One caution: only one satellite track covers this whole yard, so it gets about half the clear looks of the others, 6 to 13 per summer.)
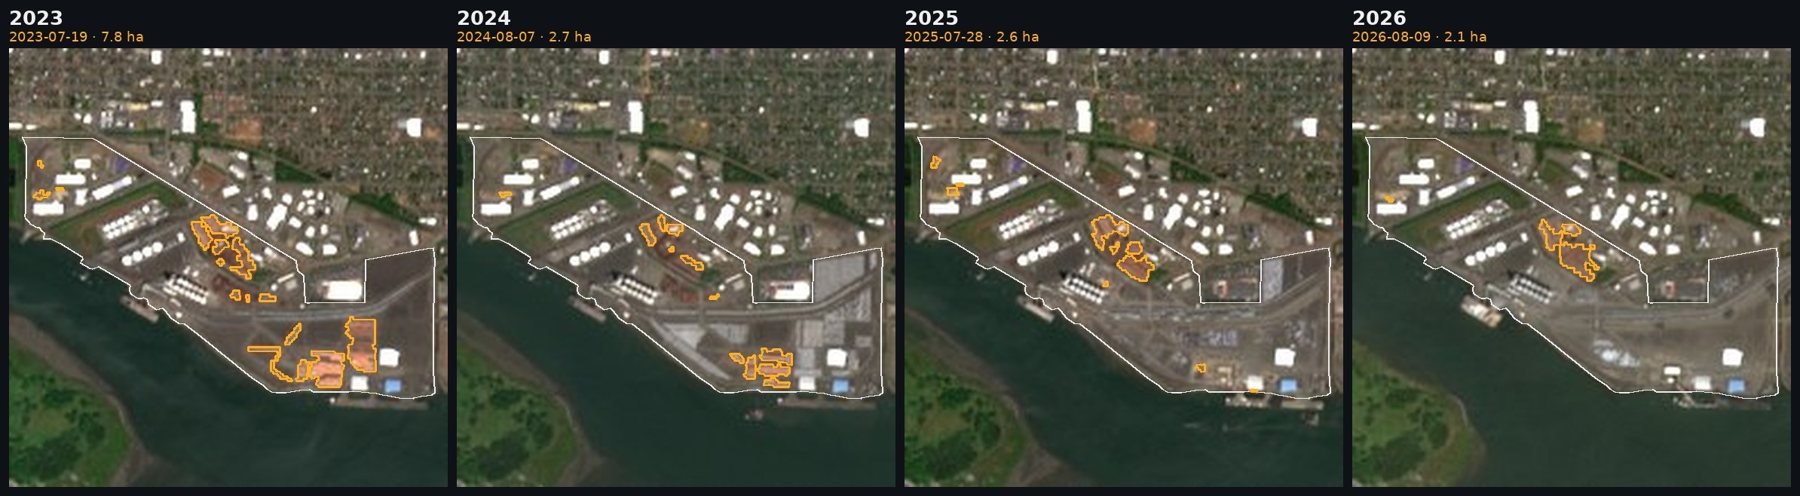
Port of Grays Harbor, Terminal 4, one clear midsummer day a year, with the log decks the classifier finds outlined.
Seattle’s Terminal 5 filled up. The terminal was rebuilt for the biggest container ships, and its modernized second berth opened in March 2024. Its container stacks held at about 3.9 hectares in the summers of 2023 and 2024, then jumped to 10.5 in 2025 and stayed near 9 this year. You can watch the stacks spread out across the yard.
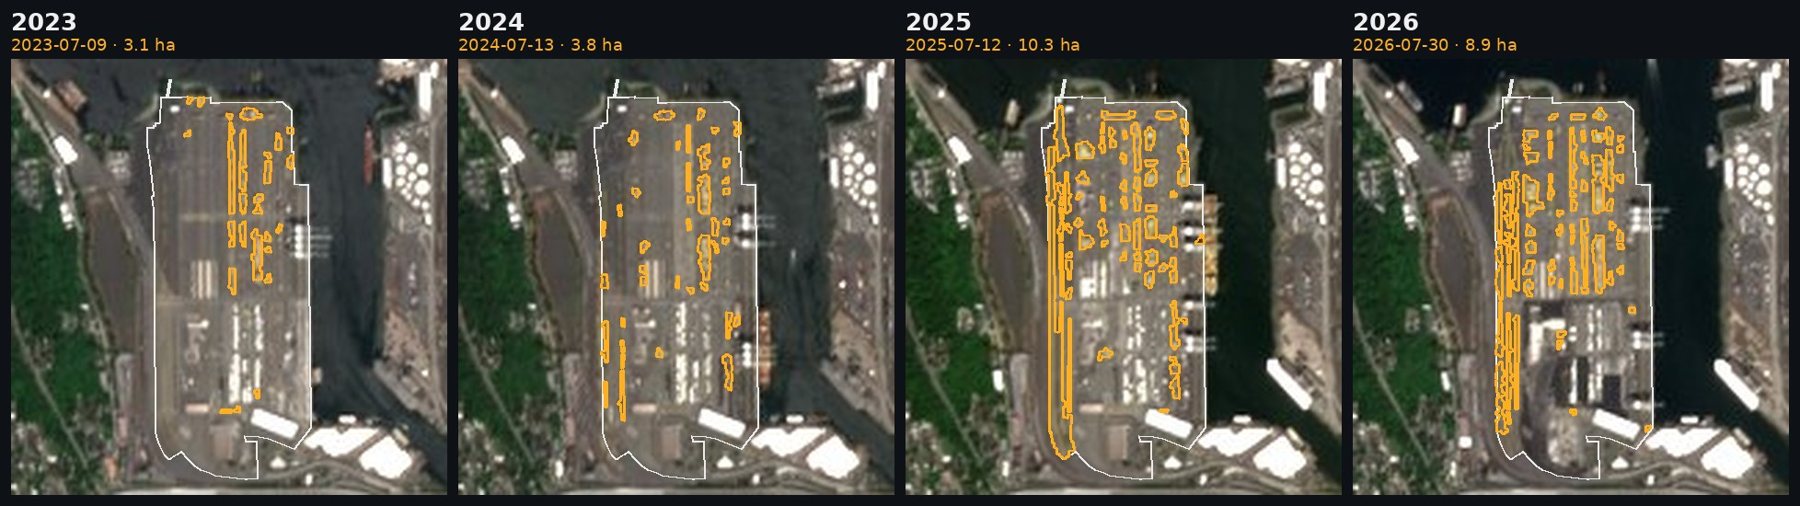
Seattle Terminal 5, one clear midsummer day a year, with the container stacks the classifier finds outlined.
The other two are quieter. Terminal 18 on Harbor Island rose from 2.5 hectares in 2023 to 4.6 in 2025, then eased to 2.1 this summer. Portland’s Terminal 6 has drifted down each year, from 3.7 to 1.7, though I’d hold that one loosely: a lot of the boxes there are blue or white, and the container rule only sees the warm-coloured ones.
The dashboard
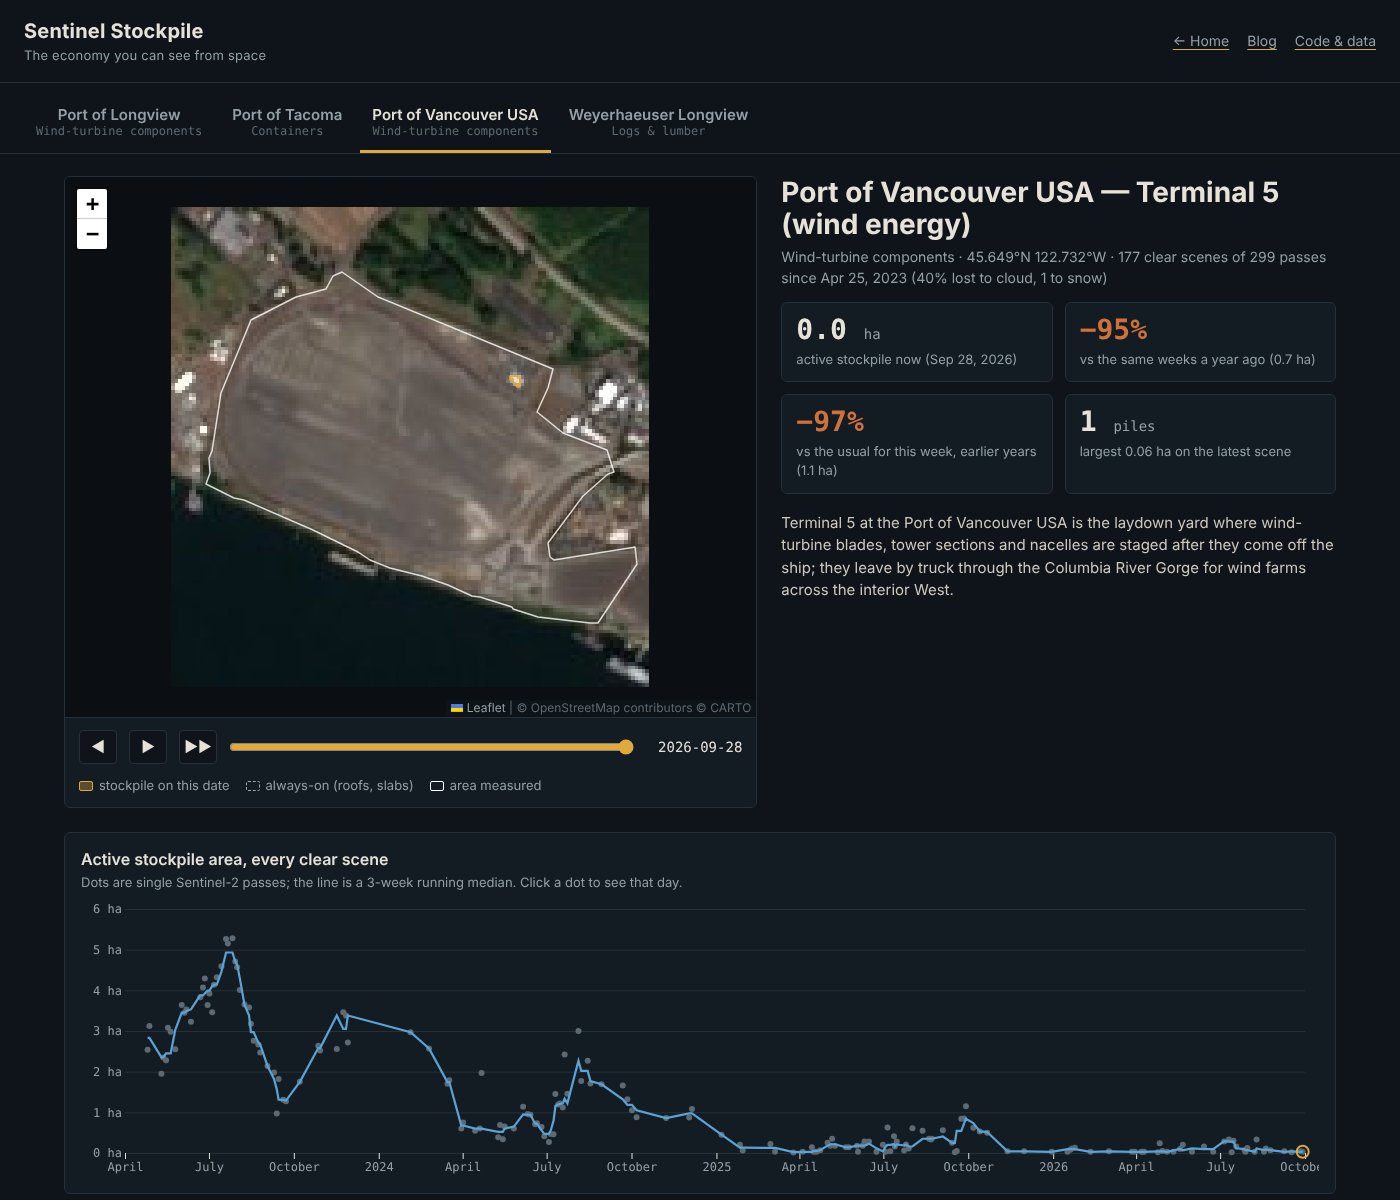
The live dashboard: pick a yard, scrub or play through every clear scene with that day’s piles outlined, and compare a week with a year ago and with what’s usual for it.
The dashboard is the part I’m proudest of. Pick a yard and you get the actual satellite picture with that day’s piles outlined, a slider to scrub through every clear pass since 2023 (or a play button to watch the yard fill and empty), and the numbers: area now, against the same weeks last year, and against what’s normal for this week. Click any dot on the chart and the map jumps to that day, so if a number looks odd you can go and see why.
It runs itself now
Every Monday and Thursday, a GitHub Actions workflow wakes up, asks Microsoft’s Planetary Computer for any new Sentinel-2 passes over each yard, screens them, classifies them, rebuilds the series and the dashboard data, and saves everything in one commit. The raw band images are cached in the repository, so changing a rule means reclassifying three years of scenes in a few minutes without downloading anything again. Adding a yard is one small file with an outline in it.
If you want to poke at it, everything is on GitHub: the rules (each with a sentence on why it works), the aerial-photo checks, a tool for trying new thresholds against the photo, and every scene’s numbers as a CSV. I’d love to point it at a few more yards: grain at Kalama, maybe, or the auto lots in Tacoma. And someday, radar, which sees straight through all those winter clouds.
For now I’ll be checking in on Terminal 5 every Monday and Thursday, to see whether the blades come back.
Contains modified Copernicus Sentinel-2 data (ESA), via Microsoft Planetary Computer. Aerial photos: USDA NAIP. Yard outlines © OpenStreetMap contributors.
Go deeper
SPACE 2: Wait, Why Are We Going To Space? — Planet Money, 1 December 2017, about 23 min. The team launches its own little satellite and meets analysts who read the economy from orbit.
Space Robots Are Helping Hedge Funds Invest — Odd Lots (Bloomberg), September 2016, about 29 min. Orbital Insight’s James Crawford on counting cars in parking lots and oil in tanks.
The Problem With Satellite Data Is …That It Is Not A Commodity — The MapScaping Podcast, 12 August 2021, about 52 min. Joe Morrison on why pixels aren’t interchangeable, and on STAC catalogues.
China’s Building Boom Revives Northwest Log Export Debate — KLCC, Amelia Templeton, 20 November 2013, about 6 min. A coastal town weighs a new log-export yard.
Sentinel-2: an introduction — European Space Agency, 27 July 2015, 3 min video. A quick tour of the satellites behind every number here.
Drusch, M., Del Bello, U., Carlier, S. et al. (2012). Sentinel-2: ESA’s optical high-resolution mission for GMES operational services. Remote Sensing of Environment 120, 25–36.
Main-Knorn, M., Pflug, B., Louis, J., Debaecker, V., Müller-Wilm, U. & Gascon, F. (2017). Sen2Cor for Sentinel-2. Proceedings of SPIE 10427, 1042704. Free copy from DLR.
Skakun, S., Wevers, J., Brockmann, C. et al. (2022). Cloud Mask Intercomparison eXercise (CMIX): an evaluation of cloud masking algorithms for Landsat 8 and Sentinel-2. Remote Sensing of Environment 274, 112990. Open access.
Donaldson, D. & Storeygard, A. (2016). The view from above: applications of satellite data in economics. Journal of Economic Perspectives 30, 171–198. Open access.
Katona, Z., Painter, M.O., Patatoukas, P.N. & Zeng, J. (2025). On the capital market consequences of big data: evidence from outer space. Journal of Financial and Quantitative Analysis 60, 551–579. Open access.
d’Autume, M., Perry, A., Morel, J.-M., Meinhardt-Llopis, E. & Facciolo, G. (2020). Stockpile monitoring using linear shape-from-shading on PlanetScope imagery. ISPRS Annals of the Photogrammetry, Remote Sensing and Spatial Information Sciences V-2-2020, 427–434. Open access.
Satellite Imagery is Not Becoming a Commodity — Joe Morrison’s friendly, clear-eyed essay on the business of pixels.
Harmonizing Sentinel-2 Data — the Planetary Computer notebook on the 2022 +1000 offset that tripped me up.
Sentinel Stockpile dashboard — all eight yards, updated twice a week. · bdgroves/sentinel-stockpile — the code, rules and data.
ESA Sentinel-2 — the mission. · Copernicus Data Space Ecosystem — free Sentinel data and browser. · Planetary Computer: Sentinel-2 L2A · Planetary Computer: NAIP · USDA NAIP Hub — the 0.6 m aerial photos used for checking.
Port of Vancouver USA · Port of Longview · The Northwest Seaport Alliance — Seattle and Tacoma. · Port of Portland · Port of Grays Harbor