I wrote SIERRA-FLOW on April 1, the evening Artemis II left for the Moon: a COBOL program, the language I learned in college in the late ’80s, reading live USGS data for eight Sierra Nevada rivers and printing a 132-column report every morning. It compiled, it ran, it ended with return code zero. Six months later I went back to make it the coolest thing on this site, and the first job was finding out whether it was right. Mostly, it wasn’t.
What it was getting wrong
“Normal” was made up. Percent of normal compared each river with a file of medians, one round number per gage for the whole year: 800 cfs for the Merced at Pohono Bridge in June and in October alike. Sierra rivers run a hundred times higher in a snowmelt June than in a dry October, so every river looked like a drought each fall. This morning, on the old version’s last run, the report had Pohono Bridge at 2.5% of normal: its 30-day average of 20 cfs against that 800. The real median for this week is about 25 cfs.
The medians belonged to other rivers. The program ranked the stations with COBOL’s SORT verb and copied each station’s numbers back into the table afterward, but not its median or alert thresholds. So after sorting, Section II printed every river against a different river’s median. The Stanislaus was being measured against Hetch Hetchy.
No river could ever fall. The trend averaged the day-to-day changes into a field declared PIC 9(9)V99: unsigned, so COBOL quietly drops the minus sign. I fed it a river dropping from 3,000 to 100 cfs, and it printed ▲ RISING.
A few more. The basin roll-up added together gages on the same river, so the Tuolumne’s water was counted up to four times. Each day’s flow was its last 15-minute reading, not the day’s mean. The rules on the “132-column” report were 97 columns wide. And the dashboard didn’t show COBOL’s results at all: it recomputed everything in JavaScript from the same made-up medians and said “NORMAL TERMINATION” whether or not the job had run.
Normal, built in COBOL
The fix is a second program, NORMALS.cob, and it’s the most mainframe thing I’ve ever written. It reads 83,499 daily means from the USGS, every day of water years 1996 through 2025 for all eight gages, and releases each one to the sort seven times, once for every day within three days of its date. The sort orders all 584,493 records by gage, day of the year and flow. Then the output procedure reads each group of about 210 values and works out the 10th, 25th, 50th, 75th and 90th percentiles. That’s a normal for every gage on every day of the year, 2,928 of them, and GnuCOBOL does the whole thing in about a second.
I didn’t take COBOL’s word for it. I recomputed all 14,640 percentiles in Python, and they agree to within half a hundredth of a cubic foot per second.
SIERRA-FLOW now uses the same classes as the USGS’s WaterWatch maps: below the 10th percentile for the date is much below normal, 25th to 75th is normal, above the 90th is much above. The program returns 0 when every gage reports and 4 when one goes stale, like a mainframe job step.
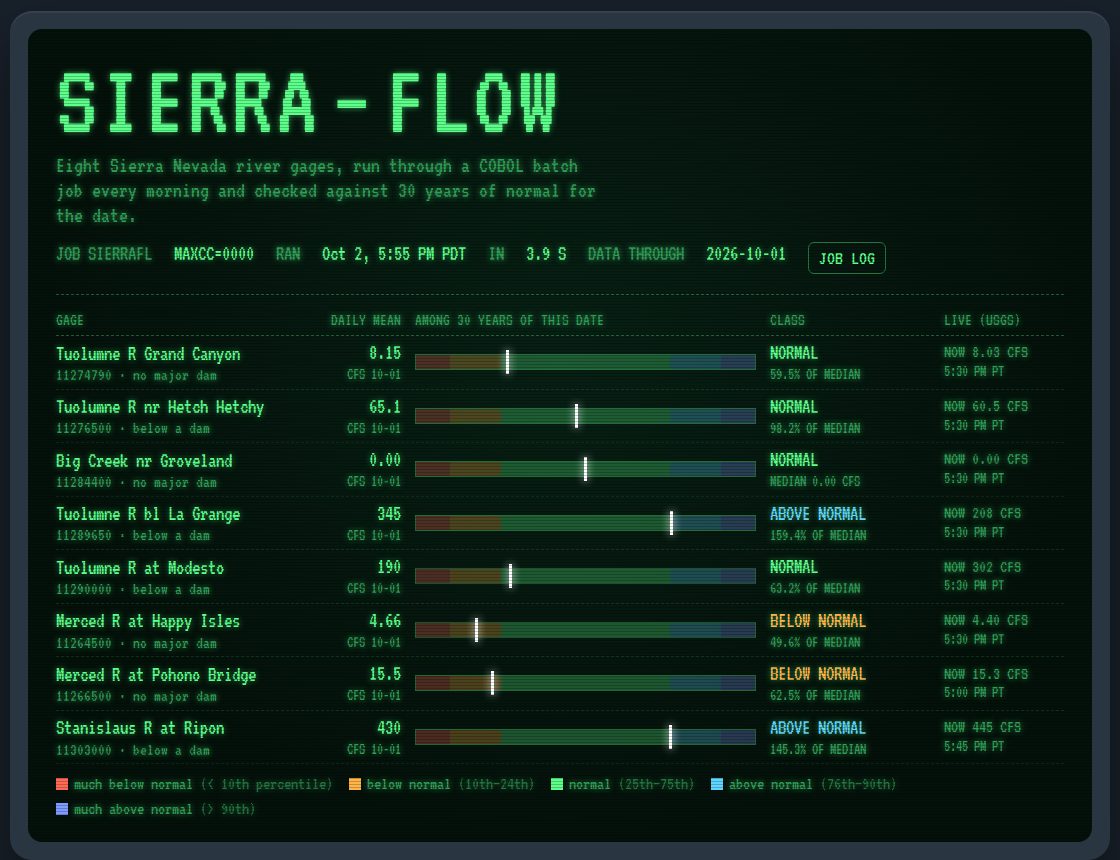
The console: each river’s daily mean, where it sits among 30 years of the same date, its class, and the live 15-minute reading from the USGS.
What the rivers say this week
Big Creek is dry, and that’s normal. The little gage near Groveland, my hometown, read 0.00 cfs every day for the last month. The old program flagged it as a low-flow alarm all 31 days. With real normals, on October 1 even Big Creek’s 90th percentile is zero: in nine years out of ten it’s dry this week. The original post also called it the only gage with no dam above it. Grand Canyon of the Tuolumne, Happy Isles and Pohono Bridge have none either.
The Merced is low. Happy Isles and Pohono Bridge, the two gages in Yosemite Valley with nothing upstream but mountains, are both below normal for early October.
The dams just let water go. Below La Grange Dam, the Tuolumne jumped to 345 cfs on Thursday, above normal. By Friday evening it was back to 208, and downstream at Modesto the river had risen from 190 to 302. You can watch the pulse travel down the river. The Stanislaus at Ripon did the same thing: it spent 22 of the last 30 days below its 10th percentile, then jumped to 430 cfs. This time of year that’s most likely a fall pulse flow, extra water released below the dams to bring salmon upriver to spawn.
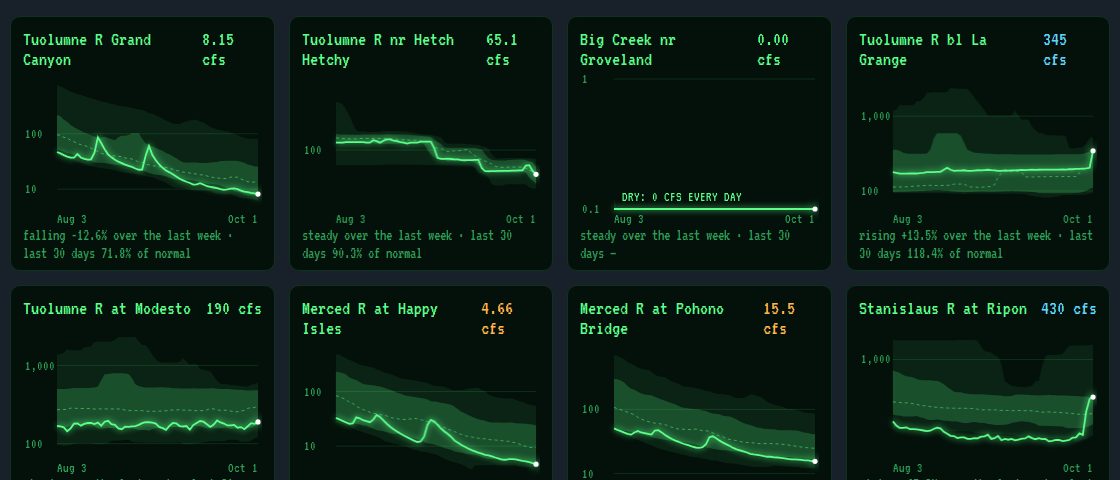
Sixty days of daily flow against the normal for those dates. The bright band is the middle half of 30 years; the faint band runs from the 10th to the 90th percentile.
Cooler than cool
The new page is built from the real artifacts of an IBM machine room, holding today’s numbers. The console at the top shows the actual job log from this morning’s run: each step, its return code and how long it took.
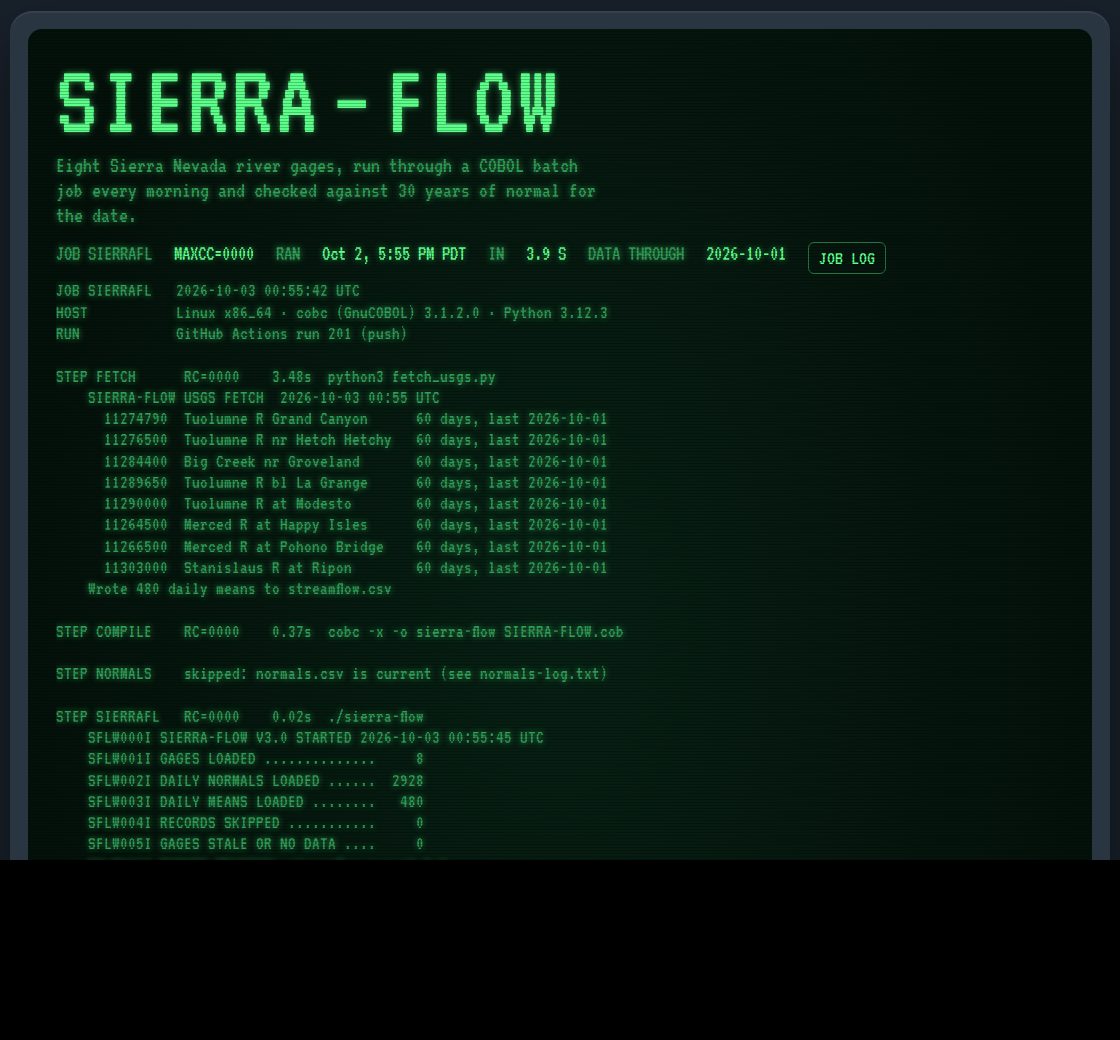
The job log from this evening’s run. The whole job took 3.9 seconds; the COBOL itself took two hundredths of one.
The report itself comes off a line printer. It’s the exact file the COBOL wrote, printed onto green-bar fanfold paper with tractor-feed holes, one line at a time when you scroll down to it. There’s a printer-sound switch, off by default.
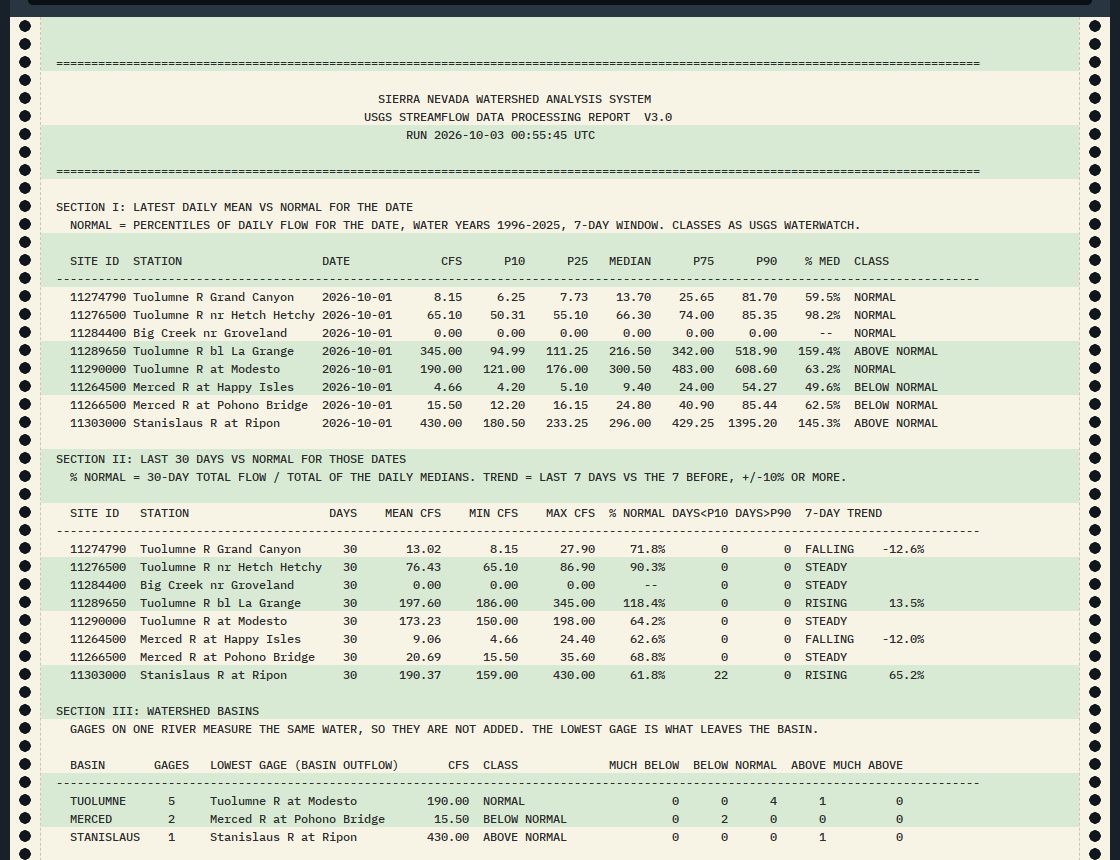
This morning’s printout, 132 columns, exactly as the program wrote it.
And the program is on punch cards. Fixed-format COBOL still keeps the shape of an 80-column card, so the page punches each line of the real source in IBM card code, the hole patterns a keypunch made. SIERRA-FLOW is 1,074 cards and NORMALS is 318: together about two-thirds of a box of 2,000. You can flip through the deck or jump straight to the paragraph that classifies a river.
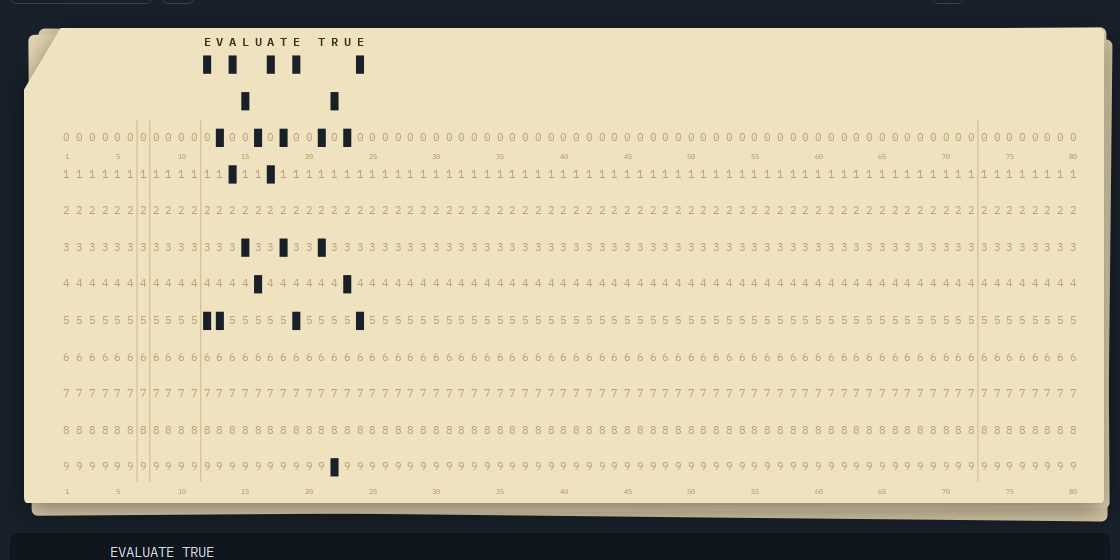
Card 653: EVALUATE TRUE, the line where SIERRA-FLOW starts deciding whether a river is normal.
How it runs
Every morning a GitHub Action on Ubuntu installs GnuCOBOL 3.1.2, a stdlib-only Python script asks the new USGS Water Data API for the last 60 daily means, and the batch job compiles and runs. The outputs are committed and the page reads them. If the USGS doesn’t answer for a gage, the job keeps that gage’s last data and flags it as stale. The normals only need rebuilding if the period changes, so the 30 years of history aren’t downloaded every day. All free, no keys.
Grace Hopper’s idea was that a program should read like what it does. Version 3 finally does what it says.
Corrections to the April post: the percent-of-normal figures there (the Merced at 206%, the Stanislaus at 40%, Big Creek at 38%) were against made-up year-round medians, not historical ones; Big Creek is near Groveland, not Hetch Hetchy, and isn’t the only gage without a dam above it; and the program processed the last reading of each day, not a daily mean. Code: github.com/bdgroves/sierra-flow-cobol.
Go deeper
Capt. Grace Hopper on Future Possibilities: Data, Hardware, Software, and People (1982) — NSA historical release, 26 August 2024, about 90 min video in two parts. Hopper herself, lecturing NSA staff in August 1982 — a gem rescued from an old tape.
Legacies: The COBOL Chronicles — Compiler (Red Hat), 28 September 2023, about 31 min. Two IBM engineers on why COBOL still runs banks and airlines, and who’ll keep it going.
‘COBOL Cowboys’ Aim To Rescue Sluggish State Unemployment Systems — NPR, 22 April 2020, about 3 min. Bobby Allyn on the retired programmers called back when the pandemic swamped 1960s-era systems.
Sammet, J.E. (1978). The early history of COBOL. ACM SIGPLAN Notices 13(8), 121–161.
Flow-Duration Curves — J.K. Searcy, USGS Water-Supply Paper 1542-A, 1959; the classic, free-to-read guide to ranking a river’s flows by how often they happen.
Vogel, R.M. & Fennessey, N.M. (1994). Flow-duration curves. I: New interpretation and confidence intervals. Journal of Water Resources Planning and Management 120(4), 485–504.
Poff, N.L., Allan, J.D., Bain, M.B., Karr, J.R., Prestegaard, K.L., Richter, B.D., Sparks, R.E. & Stromberg, J.C. (1997). The natural flow regime. BioScience 47(11), 769–784.
Yoshiyama, R.M., Fisher, F.W. & Moyle, P.B. (1998). Historical abundance and decline of Chinook salmon in the Central Valley region of California. North American Journal of Fisheries Management 18(3), 487–521.
USGS Water Data APIs — where the morning job gets its 60 days of daily means. · USGS Water Data for the Nation — every gage’s own page and history.
Modernization of Statistical Delivery and WaterWatch Decommission — USGS on retiring WaterWatch, whose percentile classes SIERRA-FLOW now borrows. · GnuCOBOL — the free compiler doing the work.
SIERRA-FLOW — the live console, green-bar printout and punch-card deck. · bdgroves/sierra-flow-cobol — the code.