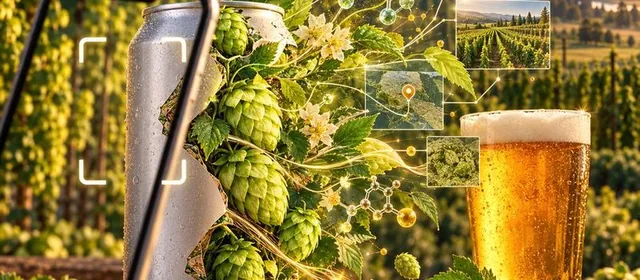
Oct 18, 2026Before handing over an old system, you read it like an inheritance. I wrote down what my COBOL streamflow job really does, rebuilt it in C#, and replayed every production night through both until they printed the same bytes. Then I broke it on purpose, and SQL Server caught USGS quietly revising its own numbers.
 Oct 7, 2026
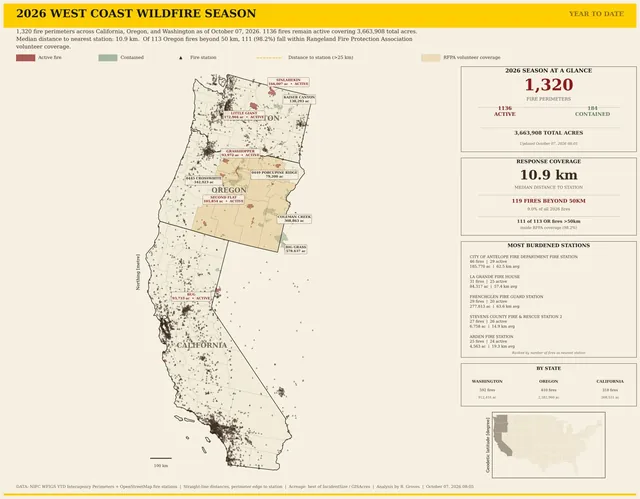
I measured how far every 2026 West Coast wildfire was from a fire station. Eastern Oregon looked like a hole in the safety net, until I mapped the ranchers’ Rangeland Fire Protection Associations: 111 of 113 far-off fires burned in counties where they operate.
 Oct 7, 2026
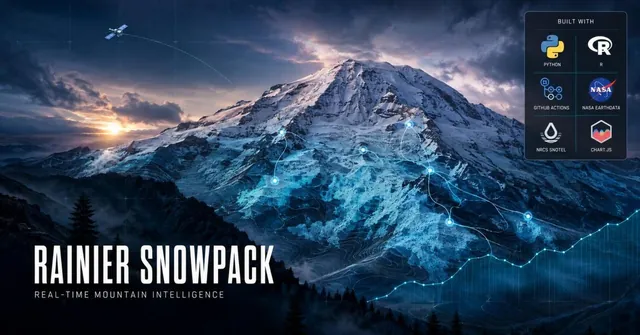
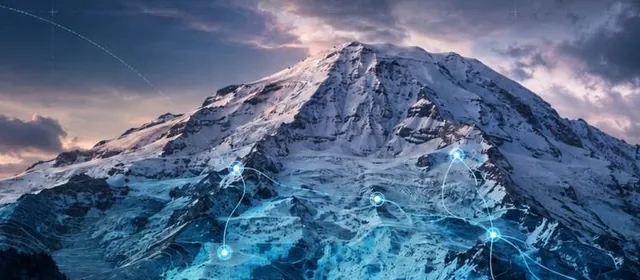
Ten snow stations, two satellites and six webcams, checked every hour: how my Mount Rainier snowpack page works, what last winter’s lean year looked like, and what four decades of El Niño winters say about the one ahead.
 Oct 6, 2026
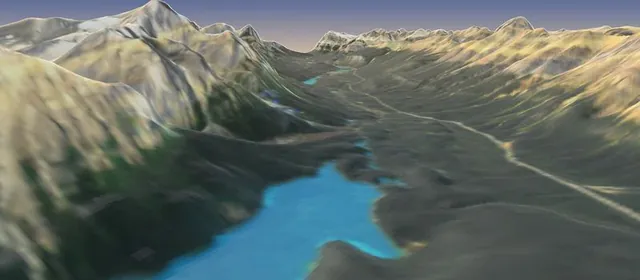
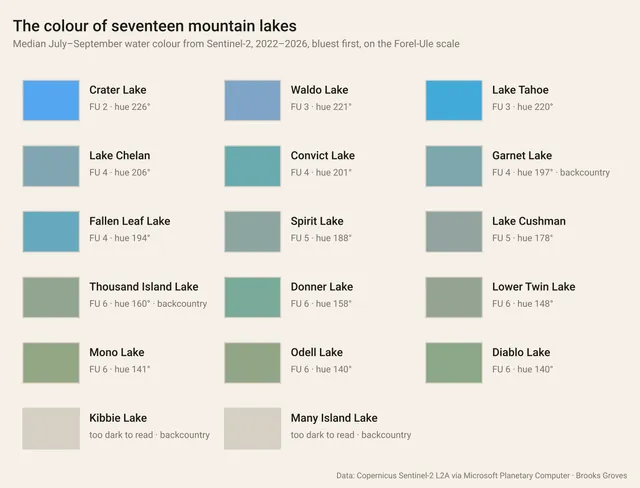
My mountain lake monitor had been coming back empty for 8 of its 13 lakes. Most lakes are never sampled, so now the satellites do the looking: Forel-Ule colour, a chlorophyll index, ice-out and summer temperature for 17 Sierra and Cascade lakes, each judged against its own past.
 Oct 4, 2026
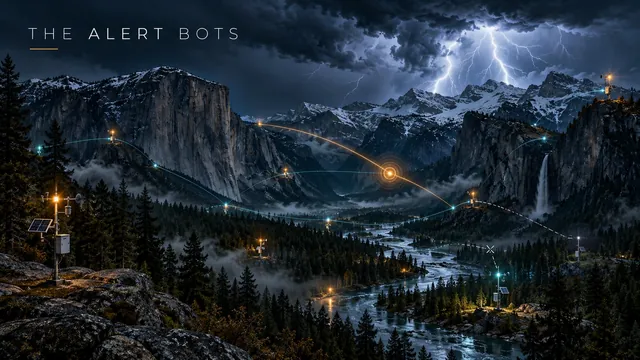
I came back to my two weather alert bots to cut the noise and found they hadn’t posted since early July, while every run said “success.” Now they post one message per storm, only what matters. Update: the silence was X’s API credits running out, so the bots are on standby, still watching.
 Oct 4, 2026
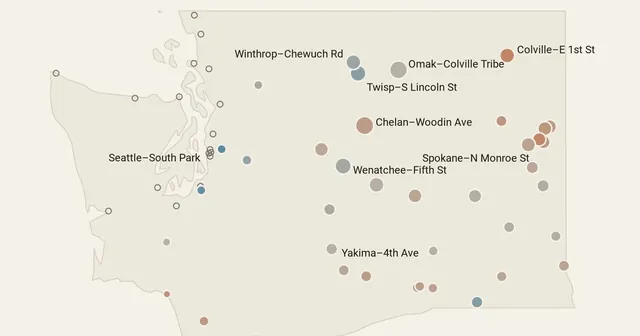
A reader asked how the smoke model in my Washington animation compared with ground-level PM2.5 monitors. Against 56 monitors over seven weeks, it was right about which days were smoky most of the time, ran heavy near Spokane right after the fires started, and ran light in the Methow valley.
 Oct 3, 2026
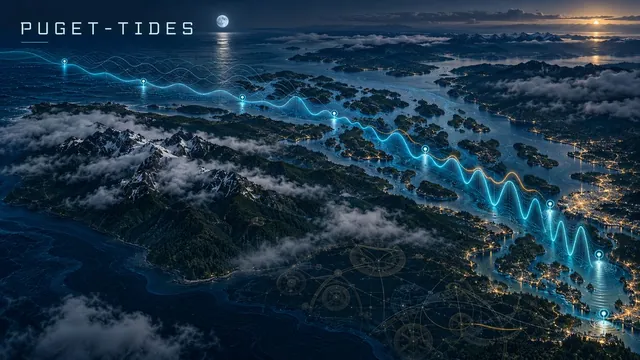
A FORTRAN program that predicts the tide at eight NOAA gauges from Neah Bay to Tacoma, the way tide tables are made, and checks itself against NOAA every six hours: all 257 highs and lows for the week, within a minute. Plus storm surge, king tides, daylight minus tides and sea level since 1899.
 Oct 3, 2026
My FORTRAN weather program said the Cascade passes were bare last April. It was asking for snow stations that don’t exist. Version 3 reads the Northwest’s four weather balloons twice a day and ranks them against 85,000 balloons from 1991 to 2020, all in FORTRAN.
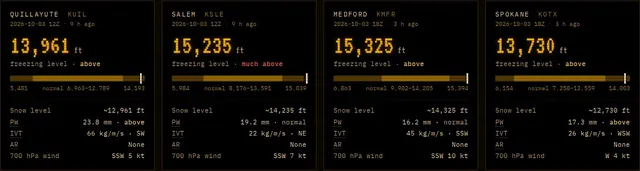 Oct 2, 2026
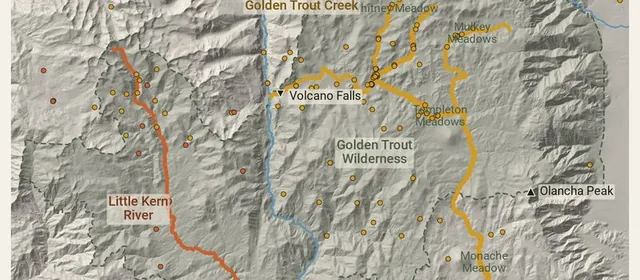
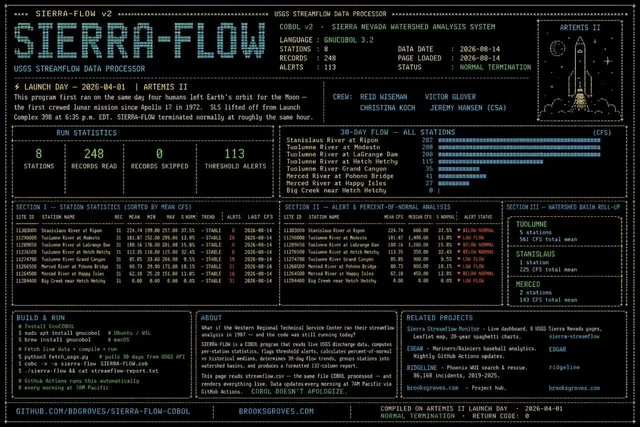
My COBOL streamflow program compared Sierra rivers with made-up medians, matched them to the wrong rivers after sorting, and could never report a falling river. Version 3 builds real normals in COBOL from 30 years of USGS data and prints them on green-bar paper.
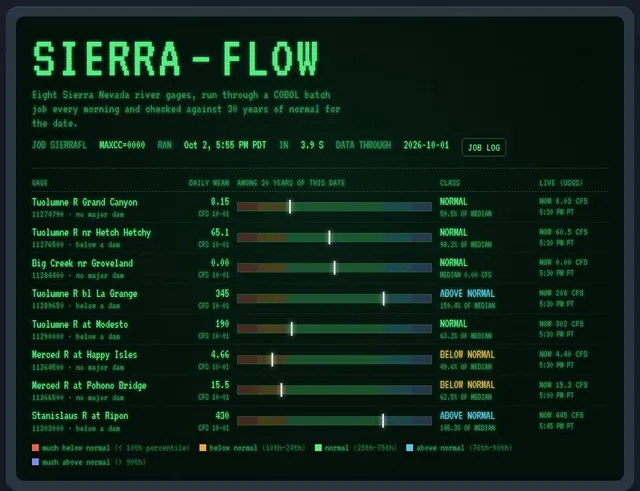 Oct 2, 2026
Water year 2026, day by day: 276 USGS river gauges against normal, NOAA snowpack and rain over 3D terrain. A record December flood, a snowpack near half of normal, and rivers running amber by June. It was a wet year and a drought year at once.
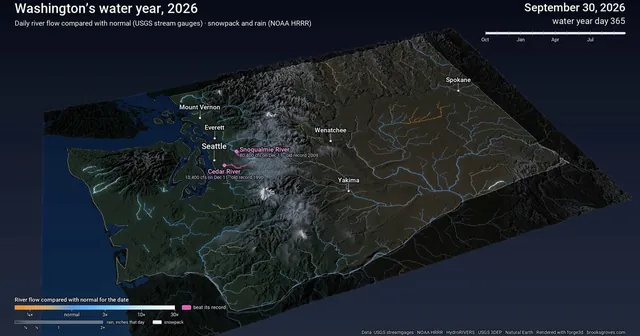 Oct 2, 2026
My weather dashboard turned out to be showing a forecast model’s guess, often hours old. Now it reads real National Weather Service observations live, runs them into the forecast, adds the forecaster’s own words, and checks it all against records back to 1893.
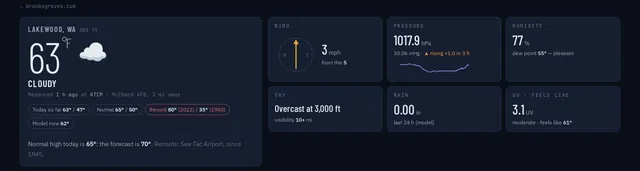 Oct 2, 2026
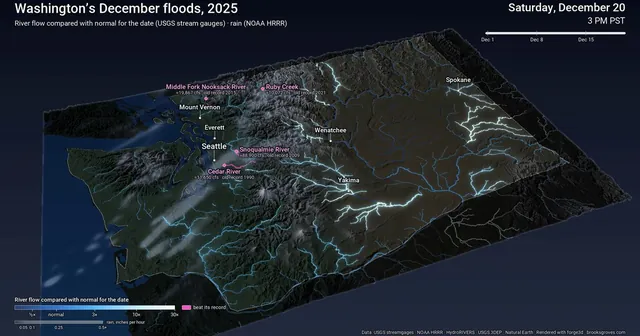
December 1–20, 2025, hour by hour: an atmospheric river stalls over Washington, the rivers light up, and the Snoqualmie, Cedar and Nooksack glow pink as they pass their records. 307 USGS gauges and NOAA HRRR rain over 3D terrain, plus why the Skagit isn’t pink.
 Oct 1, 2026
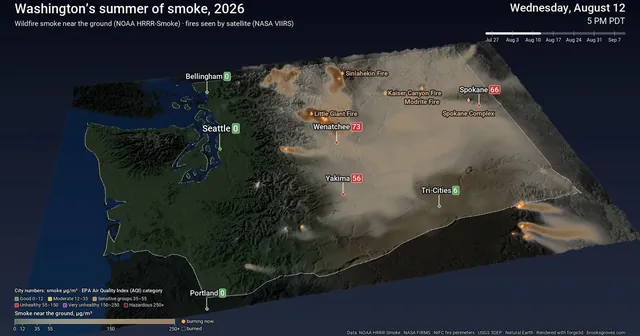
Seven weeks of wildfire smoke and fire across Washington, hour by hour: smoke streaming off the north-central fires, the Spokane Complex, and why Seattle mostly stayed blue. NOAA HRRR-Smoke, NASA satellite fire detections and fire perimeters over 3D terrain.
 Oct 1, 2026
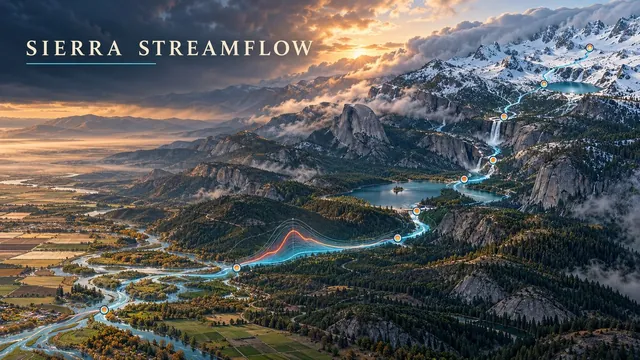
Water year 2027 began October 1 with an El Niño Advisory in effect. My Sierra streamflow dashboard's 'this year' line vanished overnight; fixing it turned into percentile bands since 1981, a look back at water year 2026, and what every strong El Niño since 1983 actually did to the Merced.
 Sep 30, 2026
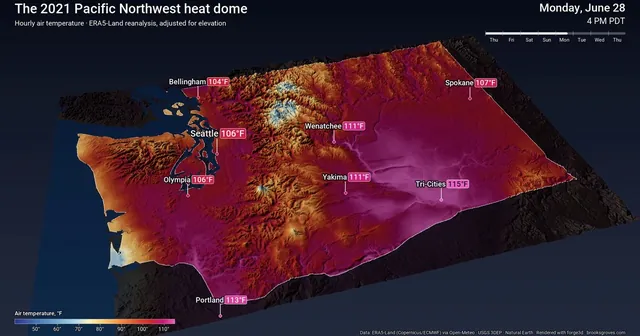
Remember when Seattle hit 108? Hour by hour across Washington through the June 2021 heat dome, from reanalysis data draped over 3D terrain with forge3d. The records, why it happened, the part that isn’t fun, and a green-screen trick for the ocean.
 2026
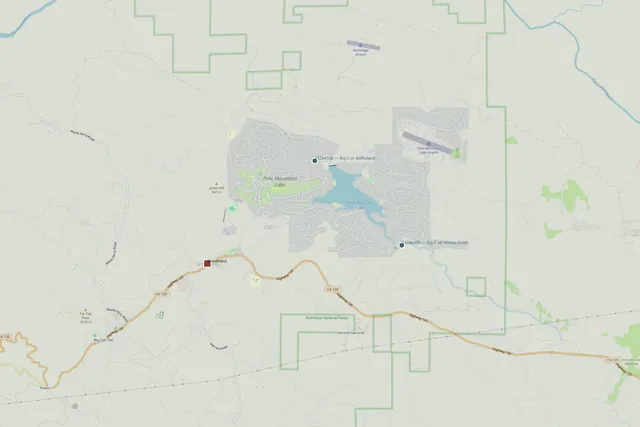
Big Creek runs dry more than a third of the time, then floods 200 times over. Asking Snowflake's warehouse-native AI agent about the creek behind my hometown, and why it only worked because a tested dbt model was underneath it — plus 170 years of Groveland history explaining why the creek was never the town's water supply.
 2026
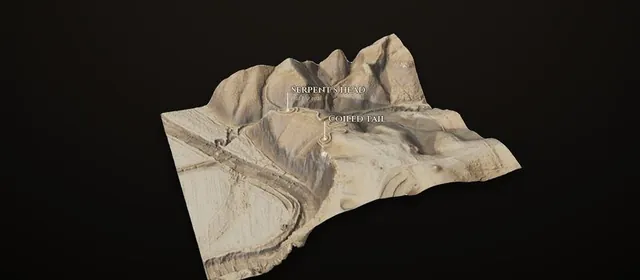
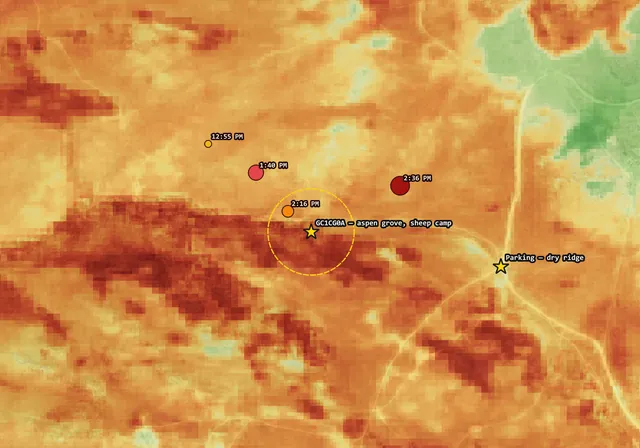
The Hawk Fire burned across Peavine Mountain north of Reno on 22 August 2026. Ninety-two minutes after ignition, VIIRS saw it 315 metres from an aspen grove where Basque sheepherders carved their names into the trunks from the 1920s onward — a spot I hid a geocache at in 2008 and used to ride a Gary Fisher Paragon to in the 1990s. Sentinel-2 burn severity, a GRASS watershed analysis explaining why the grove existed at all, and a controlled comparison showing the drainage burned +0.278 dNBR hotter than equally-fuelled ground. Includes the terrain conclusion I got wrong first, why a strong NDVI recovery curve would be bad news for the carvings, and what no satellite index can ever answer. All free public data, from eight hundred miles away.
 2026
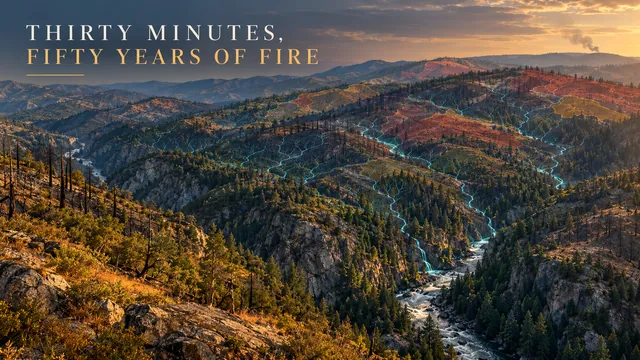
A watershed and post-fire flood-risk analysis for Tuolumne County, California — 1,151 stream segments extracted from a 30m DEM, 30 major fires from CAL FIRE FRAP overlaid on the network, and one small fire that broke out on Old Priest Grade above Groveland on the exact ground the model was studying, while it was studying it. A hydrology love letter to the county I grew up in.
 Jun 26, 2026
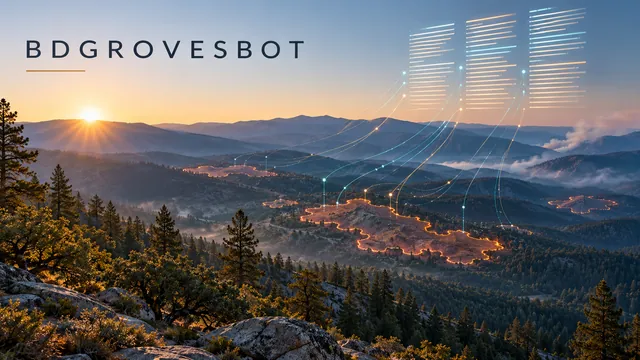
Zero to live in a day: a headless pipeline that watches WFIGS fire data and updates Wikipedia's Tuolumne County wildfire tables automatically. Python, Pywikibot, GitHub Actions, pixi, and a BRFA filed by the book.
 Jun 26, 2026
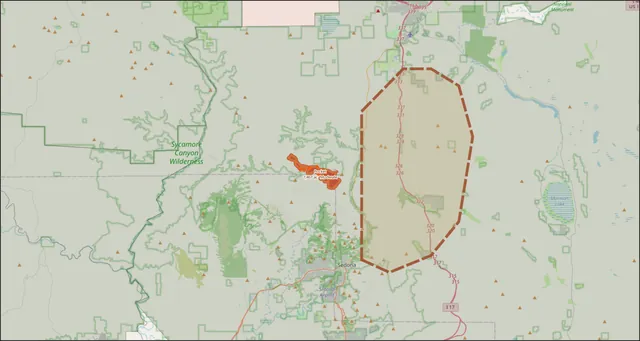
1,467 acres. 0% contained. 969 personnel. A GIS-powered field report on the Pocket Fire burning seven miles north of Sedona, AZ — live data pulled from NIFC via ArcGIS Pro MCP, mapped in QGIS, with a Red Flag Warning in effect through Sunday.
 Jun 4, 2026
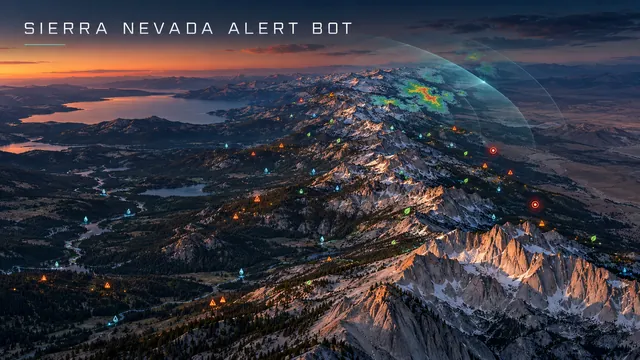
Seven federal data streams, one free runner. An autonomous monitor for the Sierra Nevada — fires, floods, quakes, air quality, severe weather — plus a MetPy and Py-ART science toolkit. Posts to @SierraNevadaWX.
 April 2026
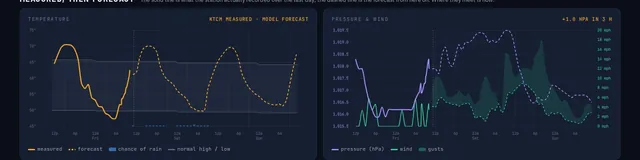
Real-time dashboard monitoring Lakewood, Groveland, Reno, and Death Valley.
 April 2026
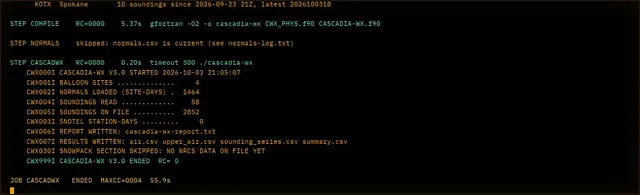
The Cascades at 15% of normal snowpack. FORTRAN has been computing the atmosphere for 75 years.
 April 2026
A 1959 language fetching live USGS telemetry on the day four humans left orbit.
GitHub Actions, USGS APIs, and a healthy respect for Pacific snowmelt.
No posts with that tag.
 🔵 secchi
 🌫️ FOG-WATCH