This spring I read Cody Cottier’s piece in Scientific American about mountain lakes turning green, with cyanobacteria blooming in a Colorado lake at 11,135 feet, and built ALPINE-WATCH to keep an eye on the Sierra and Cascade lakes I love. The plan was simple: pull the water samples scientists post to the national Water Quality Portal, twice a week, and flag any lake getting greener.
This week I opened it up for a proper look, and found that 8 of my 13 lakes had been coming back empty, and only one, Odell, had any chlorophyll readings at all. Not low, empty: no samples at all, while the dashboard cheerfully said everything was fine.
Why the lakes were empty
Part of it was the plumbing. Since March 2024 the portal’s older data service no longer gets new USGS samples, and my queries looked in a small box around a single point in each lake. But the bigger reason is simpler: most mountain lakes are never sampled at all. Nobody is hauling a boat up to Kibbie Lake, one of the largest natural lakes in Yosemite and a long walk from any road, or to Many Island Lake above it. The long records that do exist, like UC Davis’s at Tahoe, mostly live somewhere else.
So I turned the project around. If nobody can get to these lakes, the satellites can.
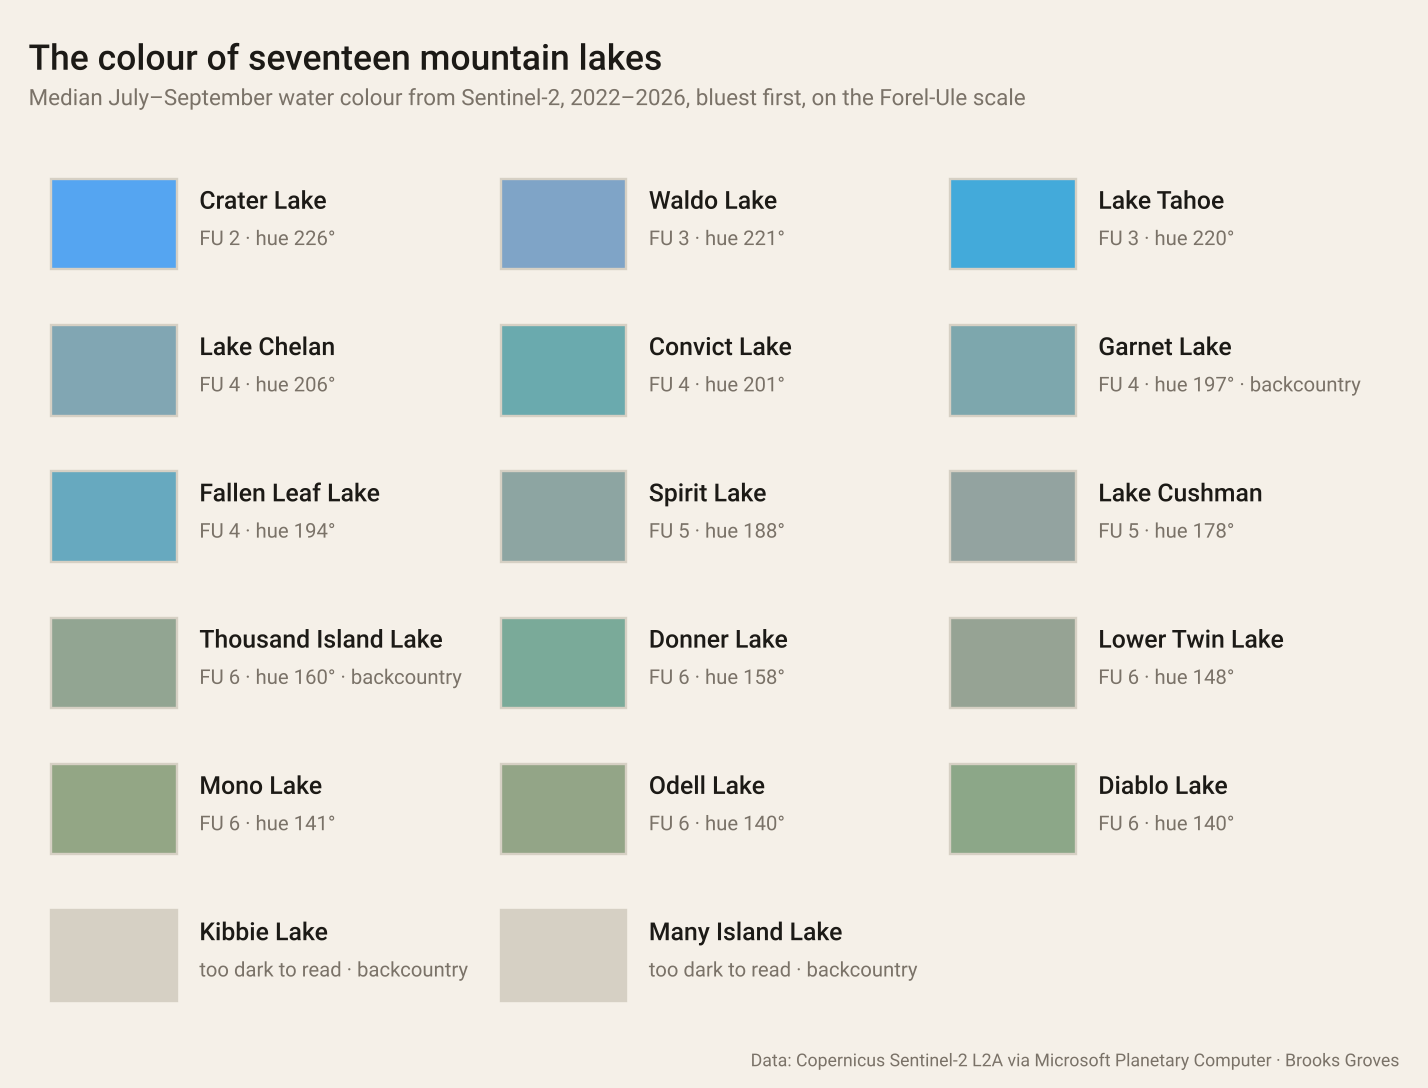
Every lake’s summer colour from Sentinel-2, 2022–2026, bluest first. Crater Lake comes out on top, as it should.
What it watches now
Seventeen lakes, from Tahoe and Crater Lake to four backcountry lakes in Yosemite and the Ansel Adams Wilderness, each traced from its OpenStreetMap outline. For every clear pass of the European Sentinel-2 satellites, every few days since 2017, it reads only the open water, staying 40 m in from shore so beaches and shallows don’t sneak in, and keeps four things:
- Colour on the Forel-Ule scale. Since the 1890s limnologists have held a set of 21 little vials of coloured water against lakes, from FU 1, deep indigo, to FU 21, cola brown. The same number can be worked out from a satellite’s visible bands, using published coefficients for Sentinel-2. It’s a lovely measure for clear lakes, where most chlorophyll methods struggle.
- A chlorophyll index (NDCI), which rises as algae thicken. I show it as an index, not as micrograms per litre, because in water this clear the conversion isn’t honest.
- Ice-out: the spring day each high lake opens up, from the satellites’ own ice and snow classification.
- Summer surface temperature from Landsat 8 and 9’s thermal band, since 2017.
And instead of holding every lake to one threshold, each lake is compared with itself. Crater Lake will always be bluer than a reservoir; what matters is whether this summer is clearly greener, warmer or more chlorophyll-heavy than that lake’s own recent summers.
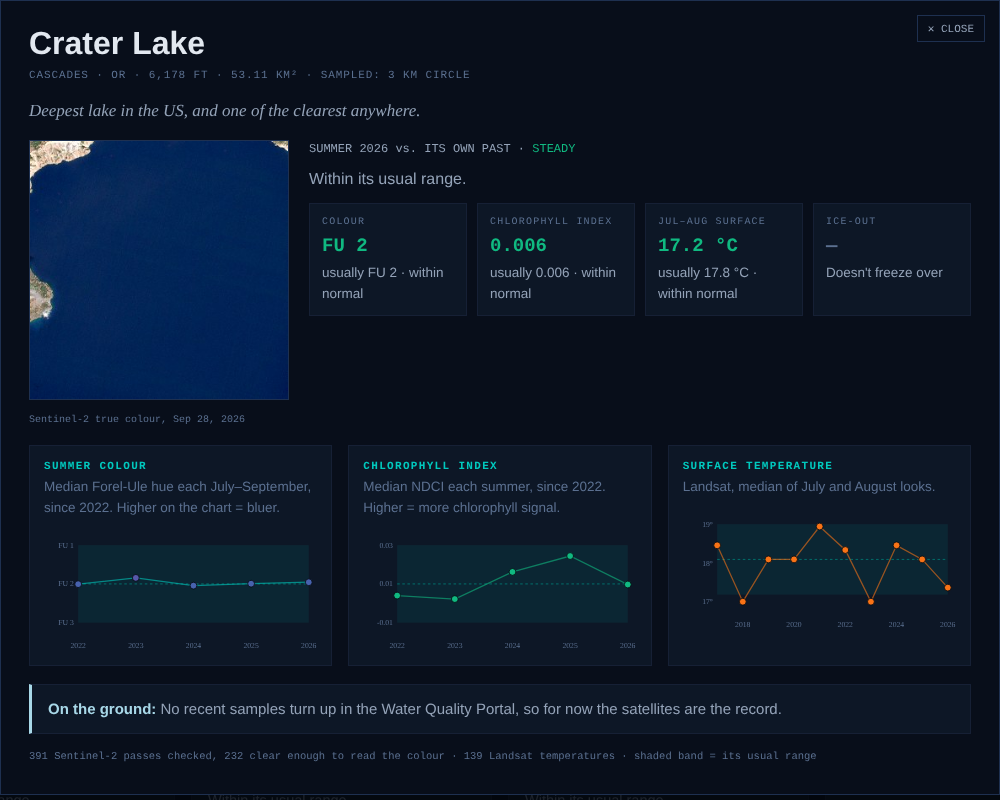
Crater Lake on the new dashboard: FU 2, right in its usual range. Click any lake on the map for its own page.
A few things the satellites taught me
Satellites are honest about what they can’t see, as long as you let them be. Building this turned up three surprises, and each one became a rule:
- The archive changed under my feet. In January 2022 ESA changed how it processes Sentinel-2, and over dark water that change can make a lake look bluer all by itself; most of these lakes read bluer from then on. Comparing 2019 with 2024 could have shown a great “clearing” that never happened, so colour and the chlorophyll index are only compared from 2022 on. Temperature and ice-out use the whole record.
- Small, dark lakes are hard. Kibbie and Many Island sit in deep granite basins, and the standard atmospheric correction often pushes their blue and green right down to zero. There’s no colour left to read then, so the page says so instead of guessing.
- Hot rock fools the thermometer. Landsat’s thermal pixels are about 100 m across. In a narrow lake every one of them catches some sun-baked granite, and Kibbie came out at 25°C in August, warmer than Tahoe. Temperature is now only used where there’s a core of water at least 150 m from any shore.
Smoke gets screened out too (August in the Sierra, of course), along with clouds, ice and slush. Diablo Lake’s famous turquoise is glacial flour and Mono Lake is salty, so their colours are shown but never set off a flag on their own.
How the lakes look this year
Most are steady. A few are worth a second look: Convict Lake and Lower Twin Lake (near Bridgeport) ran warmer than usual this summer, Lower Twin also shows more chlorophyll signal than usual, and Donner Lake came out a little greener. None of that is a diagnosis; a flag here just means “worth a closer look.” And for the backcountry lakes, the satellites caught Kibbie Lake opening up in mid-April this year.
The ground samples are still there too, now that the queries look across each lake’s whole outline: five lakes have samples since 2019, including more than 1,400 at Tahoe.
How it works: lake outlines from OpenStreetMap; Sentinel-2 L2A and Landsat 8/9 Collection 2 read a small window at a time from Microsoft Planetary Computer by a GitHub Action every Monday, one job per lake, only fetching passes it hasn’t seen. Forel-Ule colour uses the Sentinel-2 coefficients from Van der Woerd & Wernand, the same constants used in ESA’s SNAP toolbox. A lake is flagged when a summer value sits 1.5 spreads off its own recent median. The code is on GitHub.
The map, every lake’s summers and its satellite picture are on the dashboard.
Open ALPINE-WATCH Code on GitHubGo deeper
Van der Woerd, H.J. & Wernand, M.R. (2018). Hue-angle product for low to medium spatial resolution optical satellite sensors. Remote Sensing 10, 180. — how a satellite reads the Forel-Ule scale.
Mishra, S. & Mishra, D.R. (2012). Normalized difference chlorophyll index: a novel model for remote estimation of chlorophyll-a concentration in turbid productive waters. Remote Sensing of Environment 117, 394–406. — NDCI.
Copernicus Sentinel-2 L2A (ESA) and USGS Landsat 8/9 Collection 2 Level-2, via Microsoft Planetary Computer · lake outlines © OpenStreetMap contributors · ground samples from the Water Quality Portal.
Related: SECCHI, my Lake Tahoe clarity dashboard, and more water projects.
If you’re headed up to one of these lakes next summer and want to know what colour it’s been, it’s all on the map. I’d love to hear what you see.