Around here, people say “the mountain is out” the way other places talk about the weather. On a clear day Mount Rainier fills the sky, 14,410 feet of it, and you can’t help looking up. It also carries more glacial ice than any other peak in the lower 48, and every winter it piles snow on top of that ice. That snow is a savings account. It melts slowly all spring and summer and keeps the Nisqually, the Puyallup, the White and the Cowlitz running.
So I built a page that watches it. I call it Storm Chaser, after the line on the README: “You don’t chase the mountain. The mountain chases you.” Every hour it checks the snow from the ground, from space and through the webcams at Paradise, and tells you how this winter is shaping up against the ones before it.
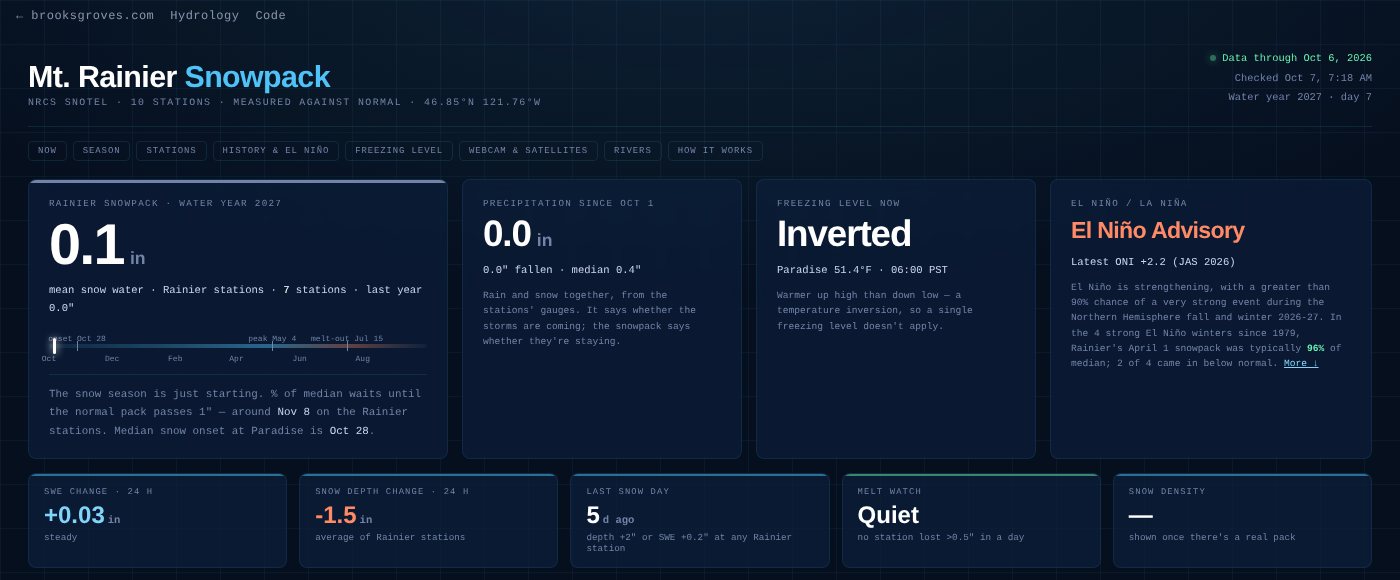
The top of the page on October 7, one week into the new water year. Almost nothing on the ground yet, and that’s normal.
Ten little weather stations in the snow
The ground truth comes from SNOTEL, a network of automated stations run by the Natural Resources Conservation Service. Each one has a snow pillow, a big flat bladder of antifreeze lying on the ground. As snow piles on top, the pressure tells you how much water is sitting in the snowpack. That number, snow water equivalent, is what matters to rivers: two feet of fluffy powder and eight inches of wet spring snow can hold the same water.
The page reads ten of them, from Huckleberry Creek at 2,250 feet up to Corral Pass at 5,810. Paradise, at 5,150 feet on the mountain’s south side, is the old faithful, with a daily record going back to 1981. Each station is measured against its own normal (the NRCS 1991–2020 median for that day), and the stations on the mountain roll up into one Rainier index: all their snow water added together, divided by all their medians added together. That way one station going quiet for a day can’t swing the number.
Every hour it also reads each station’s temperature and works out roughly where the freezing level sits. That’s the line that decides whether a storm builds the snowpack or rains on it. In the Cascades, a few hundred feet of freezing level is the difference between a great week and a washed-out one.
Last winter was a lean one
Water year 2026 (October 2025 through September 2026) was thin. On April 1, the date water managers use to size up a winter, the Rainier index stood at 63% of median, the fifth lowest of 46 winters on record. Paradise had 37.8 inches of snow water against its 1981–2026 median of 68.4, its fourth lowest. It peaked at 38.7 inches on April 23, less than half of a normal peak, and melted out on June 15, a month earlier than usual.
The page tries to say why a winter comes up short, too. When the snowpack falls below 75% of normal it checks precipitation. If the precipitation was near normal, the storms came but came warm, as rain. If it was low, the storms just didn’t come. Those are two very different winters, and they both look the same on a snow chart.
Four decades of winters, and what El Niño means here
This is my favourite part of the page. It rebuilds every winter since 1979 from the NRCS daily records: the April 1 snowpack, the peak and its date, the day snow arrived and the day it melted out. Then it colours each winter by NOAA’s Oceanic Niño Index, so you can see what El Niño and La Niña winters have actually meant on Rainier.
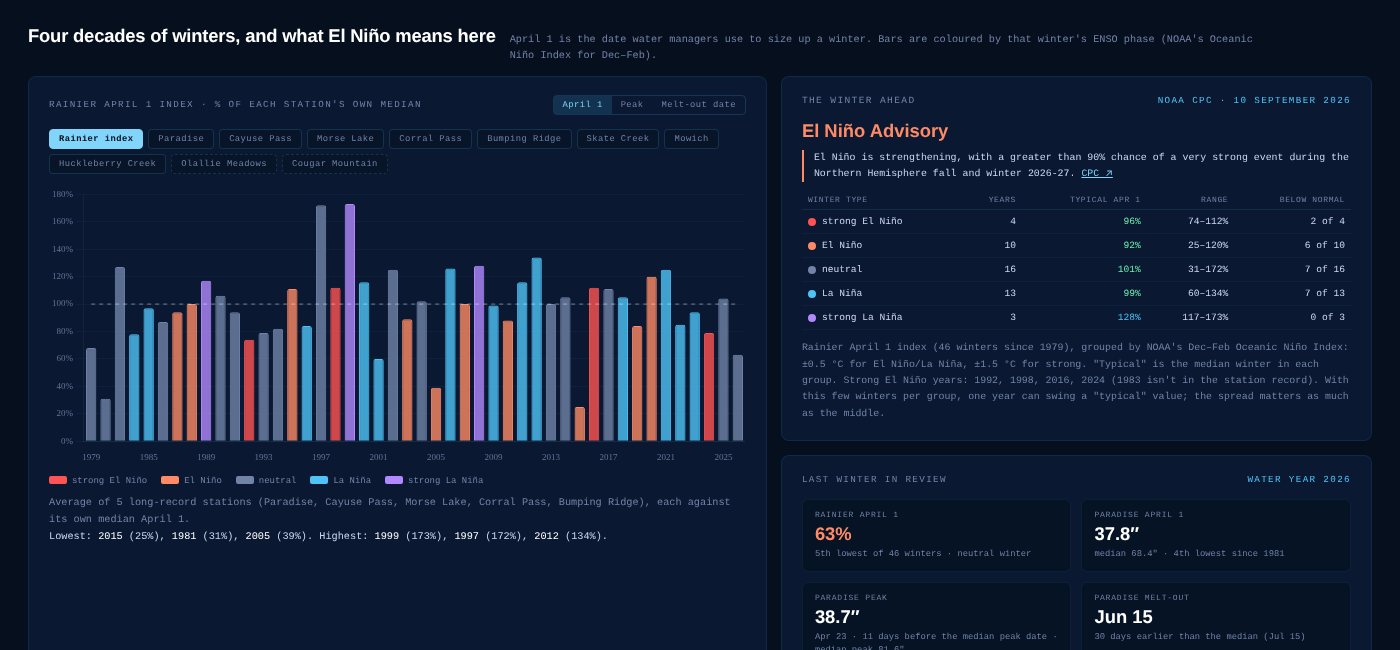
Every April 1 since 1979, coloured by that winter’s ENSO phase. Right: what each kind of winter has typically meant.
That matters right now. On September 10, NOAA’s Climate Prediction Center issued an El Niño Advisory: “El Niño is strengthening, with a greater than 90% chance of a very strong event” this fall and winter. The rule of thumb in the Pacific Northwest is that El Niño means a warmer, drier winter and less snow.
Rainier’s own record mostly agrees, but more loosely than you might think:
- Strong La Niña winters (1989, 1999, 2008) have all been big: a typical April 1 of 128%, and none of the three below normal. 1999 is the record at 173%.
- El Niño winters have typically landed a little under normal, around 92%.
- Strong El Niño winters are only four in this record (1992, 1998, 2016 and 2024), and they’ve split: two at 74–79%, two at 112%. Their typical winter is 96%.
- The very worst winter wasn’t a strong El Niño. It was 2015, a weak one, at 25% of median, a winter when the storms came warm and fell as rain.
So El Niño tilts the odds, but it doesn’t write the winter. With four strong El Niños to go on, one winter can swing the “typical” number a long way, and the page says so rather than pretending to a precision it doesn’t have. I’ll be watching this one closely.
Eyes from space
The ground stations see ten points. Satellites see the whole mountain. Every day the page pulls NASA’s MODIS snow-cover map at 500 metres a pixel, and when the clouds part, a 10-metre true-colour picture from Europe’s Sentinel-2.
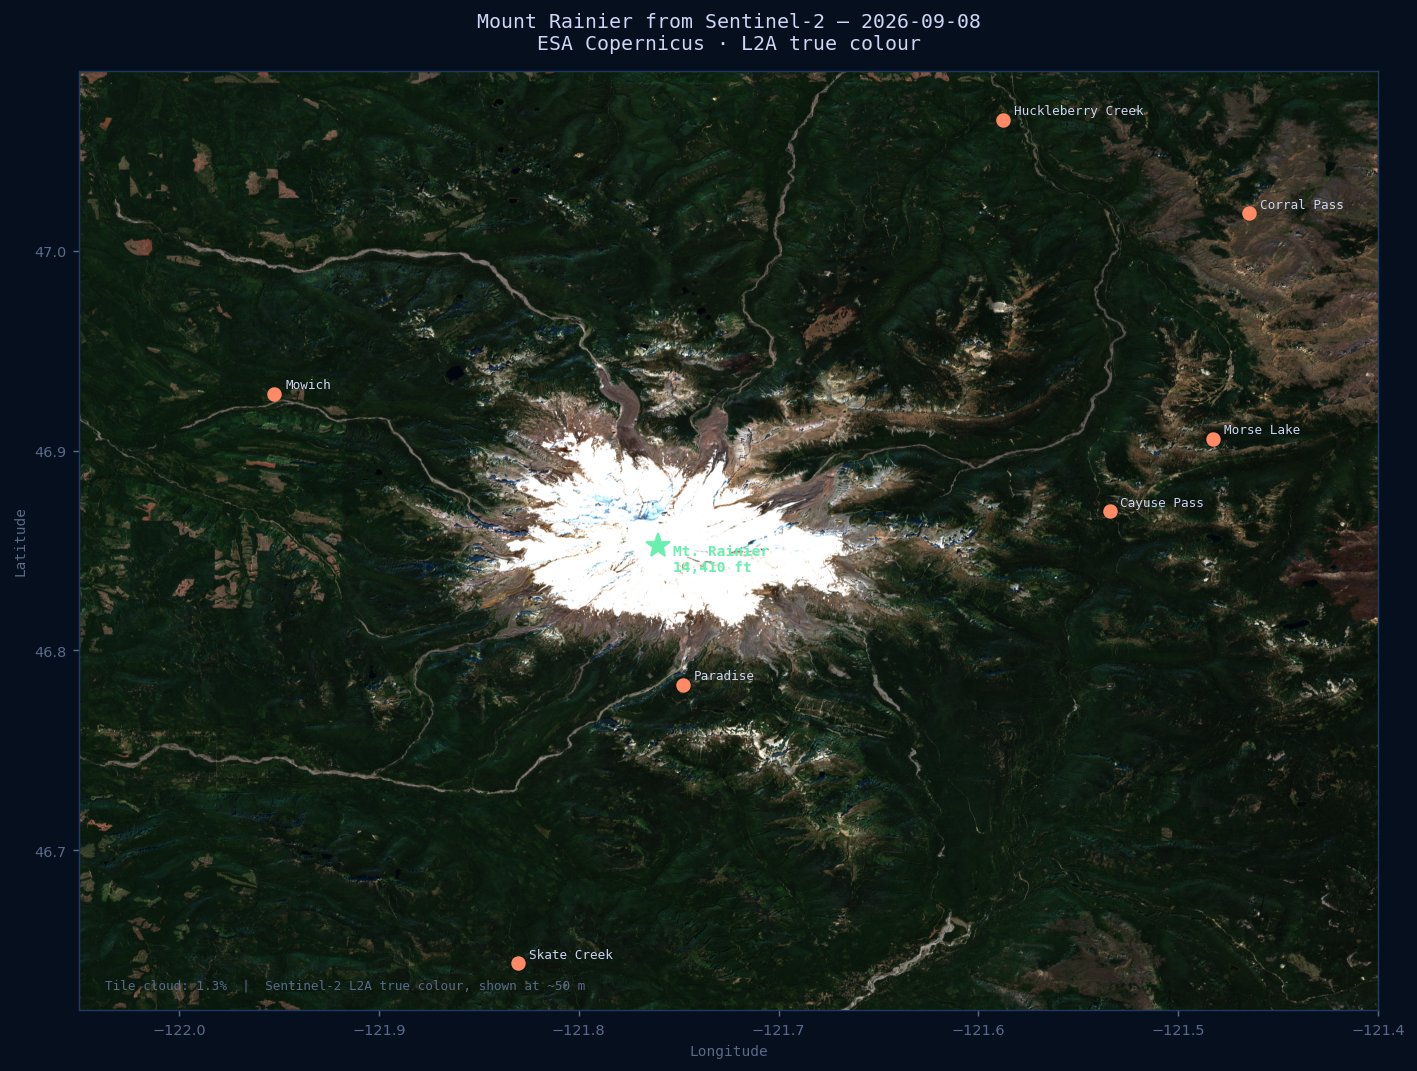
Rainier from Sentinel-2 on September 8, the last clear pass. Late summer: the glaciers and almost nothing else.
Clouds are the catch. Winter in the Cascades can hide the mountain for weeks. So when today’s view is cloudy, the page looks back up to 14 days for MODIS and 30 for Sentinel-2, and always says how old the picture is. The README puts it well: “It never shows you a lie.”
I learned that lesson the honest way. MODIS counts a pixel as snow using a brightness ratio called NDSI. The usual cut-off is low, and in late September it was calling bare forest “snow” around the mountain. I raised the bar to 0.40 so a snowy pixel has to really look like snow.
Is the mountain out?
And because sometimes you just want to look, the page carries six National Park Service webcams at Paradise and Longmire, refreshed every minute: the visitor centre, the mountain, east and west, the Tatoosh Range and Longmire. Below them, four USGS river gauges on the Nisqually, Puyallup and White, hour by hour for the last week.
The winter ahead
As I write this, a week into water year 2027, the mountain is nearly bare. Cayuse Pass caught the first dusting on October 1, and Paradise usually doesn’t keep its first lasting snow until about the end of October. Then the long climb starts. A typical Paradise winter peaks around 82 inches of water in early May and melts out in mid-July.
Will this one be an El Niño winter on the thin side, or one of the ones that surprises everybody? I don’t know. But the page will be watching every hour, and so will I.
Storm Chaser is open source at github.com/bdgroves/rainier-snowpack and live at brooksgroves.com/rainier-snowpack.
Go deeper
El Niño and U.S. winter weather — NOAA Climate.gov on the typical El Niño winter pattern, including a milder Northwest.
ENSO Diagnostic Discussion — the Climate Prediction Center’s monthly update, quoted on the page every run.
NRCS Snow and Water Interactive Map — every SNOTEL station in the West. · MODIS MOD10A1 — the daily snow-cover product from NSIDC.
Mount Rainier webcams — the National Park Service cameras at Paradise and Longmire. · The code — every fetcher and the dashboard.