Baseball season is over for Mariners fans. Seattle finished 76–86, third in the American League West, five games behind a Houston team that won the division at exactly 81–81. The Astros then lost their wild-card series to the White Sox in two games. It was a division you could have won with a .500 record, and the Mariners were in first place, or tied for it, as late as July 20.
I built EDGAR in March to follow this team: a dashboard that pulls Mariners and Tacoma Rainiers data every night through a GitHub Action and publishes it as a static site. It ran every night of the season. Opening it this week to write a season review, I found that a good part of what it had been showing me since April was empty or wrong, and nothing on the page said so.
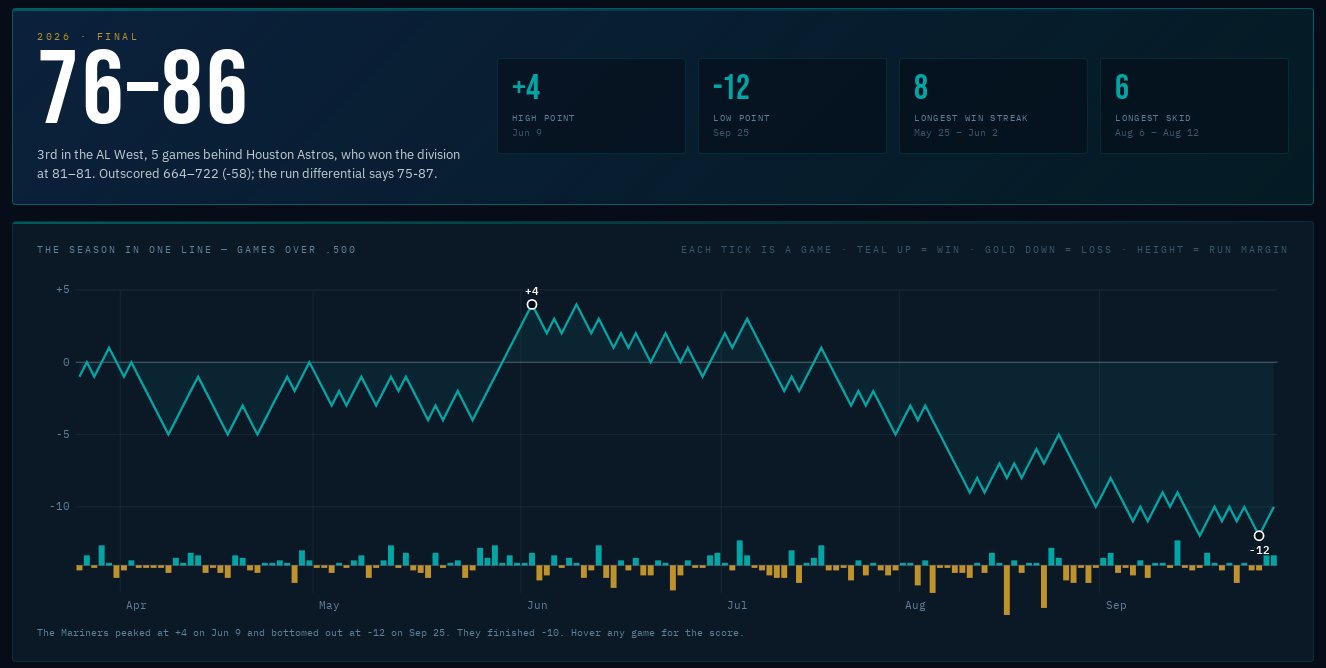
The season in one line. Each tick under the line is a game: up for a win, down for a loss, taller for a bigger margin.
The season
The line tells it better than I can. The Mariners spent April and May hovering around .500, caught fire in late May with an eight-game winning streak, and reached their high point, four games over, on June 9. They were still at the top of the division on July 1. Then the line falls off a ledge.
August was the month: 11–16, scoring 3.5 runs a game while allowing 6.3. It includes a six-game losing streak from August 6 to 12 and a 22–0 loss in Milwaukee on August 18. By September 1 they were five games back, and they bottomed out at twelve under on September 25. A 19–1 win over the Athletics on September 12 was the biggest margin of the year in the other direction.
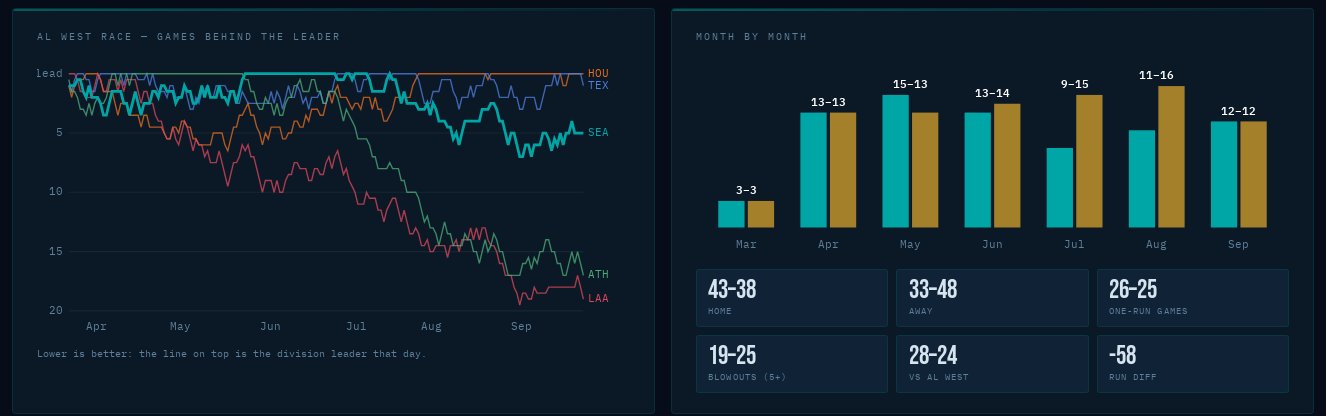
Left: games behind the AL West leader, every day of the season. Right: month by month, with the home, road and one-run records.
The splits fill in the shape. The Mariners were 43–38 at T-Mobile Park and 33–48 on the road. They were a coin flip in one-run games (26–25) and actually beat their own division, 28–24. They were outscored 664 to 722 over the season. A run differential of −58 predicts a 75–87 team, so the record wasn’t unlucky. It was about right.
| Who | The season in a number |
|---|---|
| Randy Arozarena | .865 OPS, 26 home runs, 26 steals in 670 plate appearances. The best bat on the team, though Statcast thinks his .281 average ran about 20 points ahead of his contact. |
| Cal Raleigh | A .182 batting average and 23 home runs. His barrel rate, 14.1%, was second on the team. |
| Logan Gilbert | 186 innings, 3.73 ERA, and the best strikeout-minus-walk rate (20.8%) and CSW% (30.1%) in the rotation. |
| Bryan Woo | A 4.01 ERA, but a 3.24 FIP: the strikeouts, walks and homers said he pitched better than his runs allowed. |
| Andrés Muñoz | A 37.1% strikeout rate and the best CSW% on the staff, 35.4%. Also 10 blown saves. |
What the dashboard got wrong
None of these threw an error. That’s the common thread, and it’s the same lesson I relearned on PELE this morning.
- The Advanced Pitching tab was empty from early April to October. It read FIP, CSW% and pitch mix from FanGraphs. FanGraphs started refusing those requests, the fetch returned an empty list, and the empty list was published. Every night, for six months, “No starter data yet.”
- Barrel%, hard-hit% and sweet-spot% were blank all season. The code asked Baseball Savant for columns by names Savant doesn’t use. The other columns worked, so the table looked half-full rather than broken.
- Players vanished. Stats came from the active roster on the day of the fetch, so anyone traded, released or optioned disappeared from the season: Luis Castillo’s 99⅔ innings, Luke Raley’s 15 home runs, Matt Brash.
- The team totals were wrong. They were added up from that partial roster: 647 runs instead of 664, 157 home runs instead of 182. Innings were added as decimals, which doesn’t work when “.2” means two outs.
- The standings were thinner than they looked. Streak, last ten and run differential came back empty all year, and the “wild card” table was just the ten best records in the league, division leaders included.
- The Rainiers’ results went blank a week after the Triple-A season ended, because the page showed “the last seven days.”
The fix
Everything now comes from two sources that still answer: the MLB StatsAPI and Baseball Savant. FIP is computed from the counting stats with this season’s league constant, xERA comes from Savant’s expected-stats leaderboard, and CSW%, swinging-strike rate and each pitcher’s arsenal are counted from Savant’s pitch-by-pitch data, nearly 3,000 pitches for Logan Gilbert alone. Player stats come from an endpoint that returns everyone who appeared for Seattle, filtered to their Seattle games, and the team totals are the official ones.
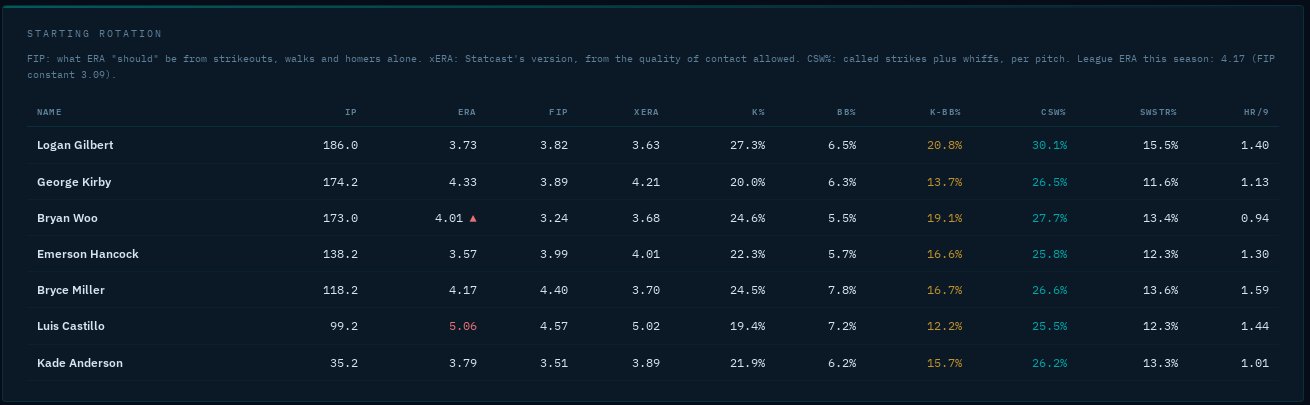
The Advanced Pitching tab, populated for the first time since April. The ▲ marks an ERA well above FIP.
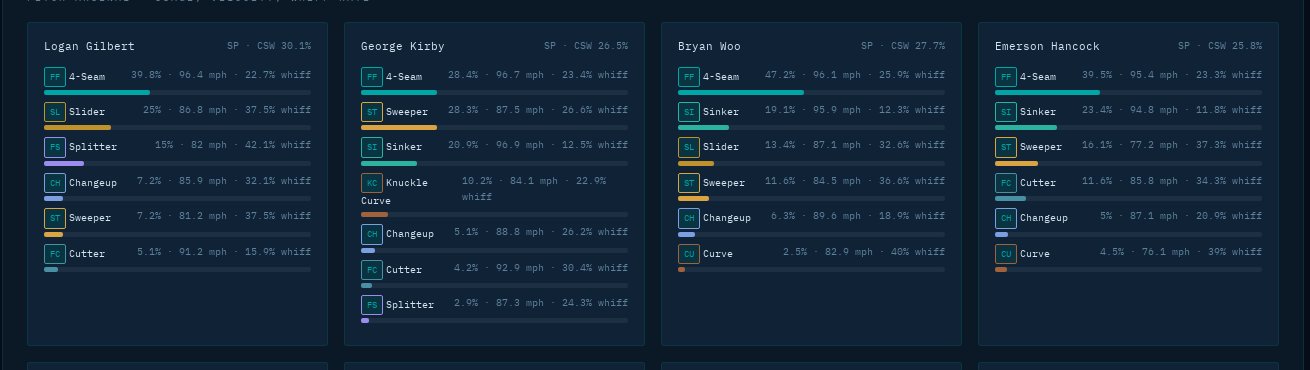
Each pitcher’s arsenal from Savant pitch-by-pitch data: how often, how hard, and how often hitters missed.
Two rules keep it honest from here. A fetcher only publishes when its output passes a basic check (enough players, a real FIP, a barrel rate that isn’t blank); otherwise yesterday’s file stays up and the Action logs a warning. And every run writes a small health file that the page footer shows, so a module that stops updating says so in red instead of quietly going stale.
Next year
The Mariners will be back in March. So will EDGAR, with every number it shows checked against the thing it claims to be. Until then, the postseason is on the Season tab, and the Astros are already out.
EDGAR is open source at github.com/bdgroves/EDGAR and live at brooksgroves.com/EDGAR. Data from the MLB StatsAPI and Baseball Savant.