When I built PELE in April, Kīlauea ran like a clock. It had fountained 43 times since December 2024, and HVO was forecasting Episode 44 inside a one-week window. I wrote that the tiltmeters knew “exactly how much microradian tilt means tomorrow versus next week.” The volcano kept that rhythm all summer, through Episode 54 on August 25. Then it stopped.
As I write this it has been 36 days without a fountaining episode, the longest pause of the whole eruption. The old record was 29.7 days, the gap after Episode 43’s record fountain in March. In mid-September six new vents opened on the crater’s northwest wall and poured lava onto the floor without fountaining. And on the afternoon of September 30 the summit started shaking: 36 earthquakes that day in my data, 31 of them right under Halemaʻumaʻu, while the summit tiltmeter, flat all week, shot straight up. HVO’s read was a shallow intrusion, magma pushing into an east–west crack near the eruption site.
So I went back to the dashboard I built for a birthday trip, to see whether it could actually show any of that. Mostly, it couldn’t.
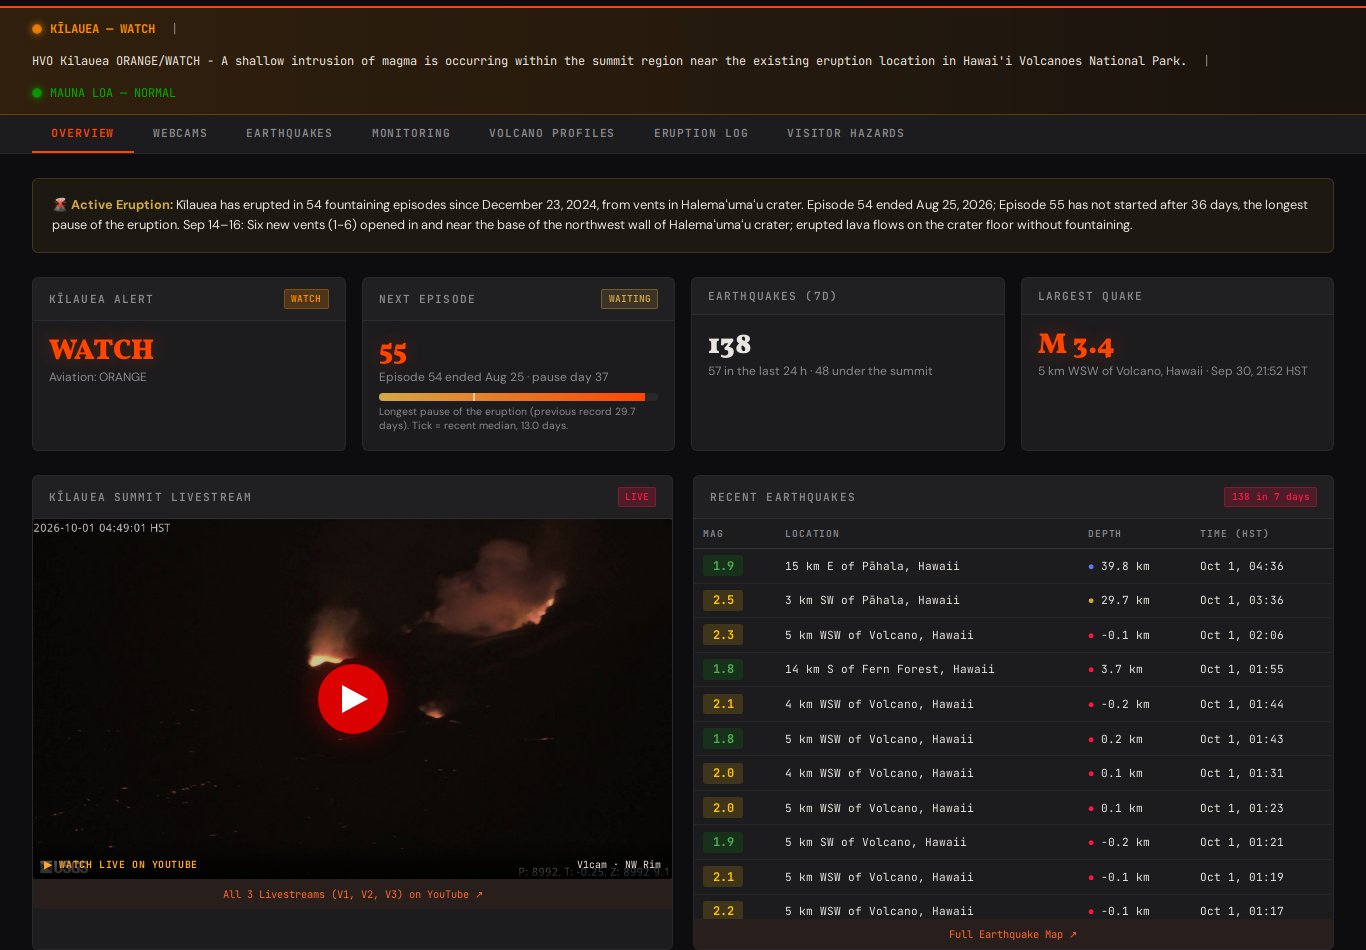
PELE on the morning of October 1, 2026. Episode 55 is waiting; the pause bar has run past the old record.
What it got wrong
I’ll start here, because some of it was embarrassing.
- It was hiding the swarm. The earthquake query asked USGS for everything up to “today,” written as a date. The API reads a bare date as midnight UTC, which in Hawaiʻi is 2 p.m. the day before, so every quake since then was silently dropped, up to a full day’s worth depending on when the job ran. On the day of the intrusion the dashboard showed 94 quakes for the week. The real number was 138.
- The episode counter was frozen at 45. I’d hand-written the eruption log, and hand-written logs go stale. Worse, I’d added a shortcut that pulled an episode number out of the latest HVO notice. The September 30 notice said “Episode 55 fountaining remains a possibility,” and my shortcut would have proudly announced Episode 55 as erupting.
- “Elevated volcanoes” meant the whole country. The count of volcanoes above Normal included every elevated volcano in the United States. In Hawaiʻi there’s exactly one.
- Mauna Loa’s main webcam had been frozen since February 22. The image still loaded, so the page looked fine. It was a seven-month-old picture.
- The new quake map went out with “API KEY REQUIRED” stamped across it. That one was mine, today. CARTO’s dark basemap started requiring a key in September, I used it anyway, and I didn’t spot it until the map was live. It’s on Esri’s keyless dark canvas now, like the rest of my maps.
None of these threw an error. That’s the lesson I keep relearning: the dangerous bugs on a live dashboard are the ones that produce a plausible number.
What 54 episodes look like
The fix for the frozen counter was to stop writing the log by hand. USGS keeps a table of every episode on its eruption-information page: start, end, duration, fountain height, lava volume, pause. PELE now reads that table every hour with Python’s built-in HTML parser and turns it into JSON. It took two tries, because the table writes times as “4 p.m.” in some rows and leaves the year off end dates in others, and the first version left five episodes without dates.
| Measure | Value |
|---|---|
| Fountaining episodes | 54, from Dec 23, 2024 to Aug 25, 2026 |
| Typical episode | About 9 hours of fountaining |
| Tallest fountain | 540 m (1,772 ft), south vent, Episode 43, March 10, 2026 |
| Lava erupted | About 317 million cubic metres |
| Median pause, first 20 episodes | 5.4 days |
| Median pause, last 10 episodes | 13.0 days |
| Longest pause before now | 29.7 days, after Episode 43 |
| Current pause | 36+ days and counting |
Charted episode by episode, the slowdown is the story. Early on Kīlauea fountained every few days. By this summer it was every two weeks, and the fountains were getting shorter, around 150 metres for the last three episodes against 200–300 in the spring. A volcano with a steady supply of magma and a shallow reservoir that fills and empties will keep a beat. When the pauses stretch and the fountains shrink, something in that system is changing, and nobody, including HVO, can say yet whether the next chapter is Episode 55, a different kind of eruption, or a long rest.
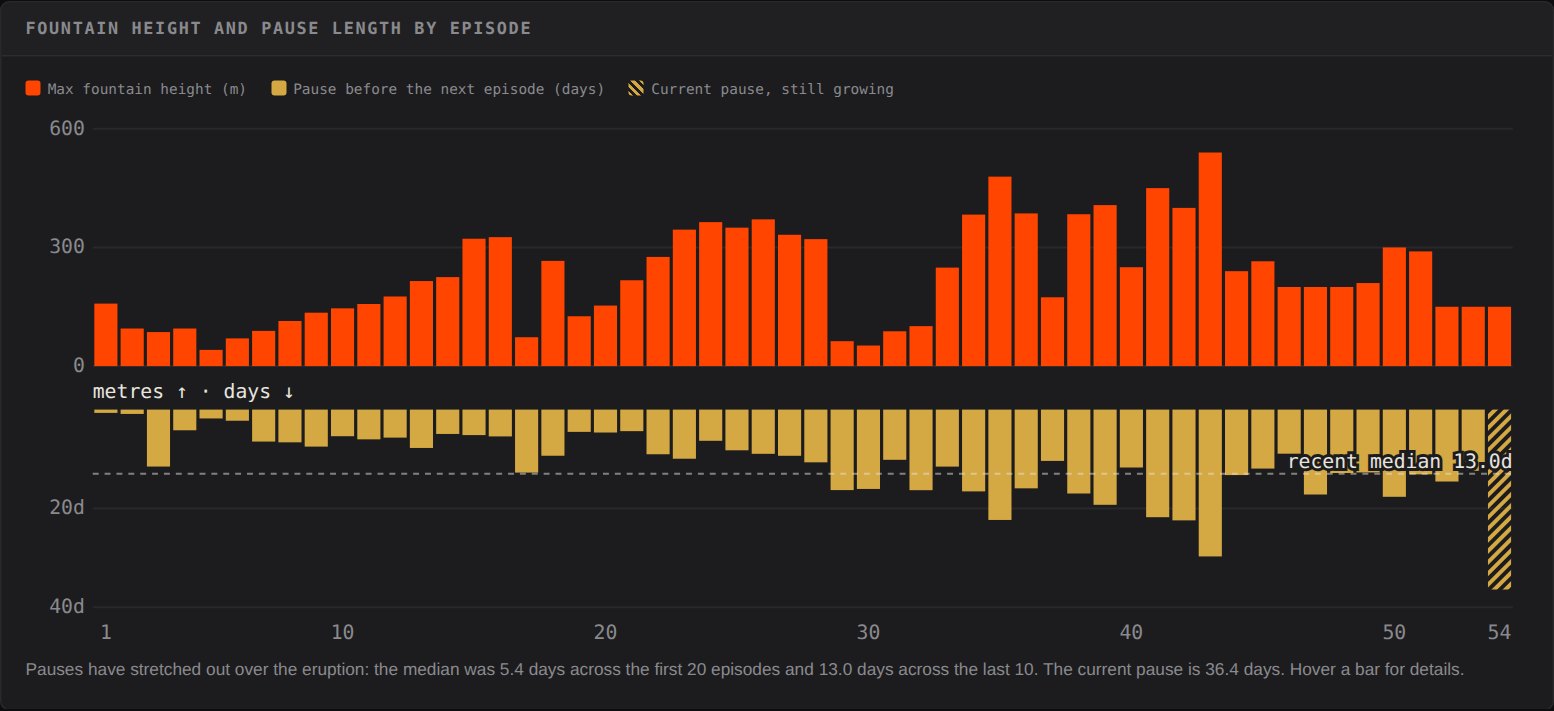
Fountain height above, pause below. The hatched bar on the right is the pause that’s still running.
Reading the sawtooth
The single best instrument for following this eruption is a tiltmeter called UWD, on the west rim of the caldera near Uēkahuna. It measures how much the ground tilts in microradians; one microradian is a kilometre-long beam lifted at one end by a millimetre. While magma refills the reservoir beneath the summit, the ground swells and the line climbs. When an episode starts, the reservoir drains through the vents and the line falls off a cliff. Plot it since December 2024 and you get a sawtooth, one tooth per episode.
In April, PELE linked to that plot. Now it shows it. USGS draws these plots from live instruments and publishes them as images that update through the day, so PELE’s new Monitoring tab puts them on the page: summit and rift-zone tilt for the past week, month and year; the full-eruption sawtooth; the height of the crater floor, which climbs a step with every episode as new lava piles up; sulfur dioxide; GPS stations stretching apart as the caldera inflates; and Mauna Loa next door, where summit tilt and GPS show whether magma is recharging after its 2022 eruption. Each plot has a short note on how to read it.
On October 1, the week view of UWD is the most dramatic picture on the site: seven days of almost nothing, then a near-vertical line on the evening of September 30. That isn’t the slow ramp of a reservoir refilling. It’s the ground moving as a crack opens and fills with magma.
Earthquakes in depth
The other half of the story is underground. PELE now tags every quake within 100 km by where it is: the summit, the rift zones, Mauna Loa, or the deep swarm under Pāhala, which has run for years about 30 km down and has nothing to do with the fountains. Then it plots depth against time for the last 30 days.
The result is two bands. Way down at 30 km is the steady blue scatter of Pāhala. Up at the very top, in the first few kilometres, is a tight orange cluster on September 30 and October 1: 49 quakes under the summit, all shallower than 5 km, in 48 hours. A typical day this month had one. Magma forcing its way up cracks rock as it goes, which is why a burst of shallow summit quakes is one of the clearest signs of an intrusion.
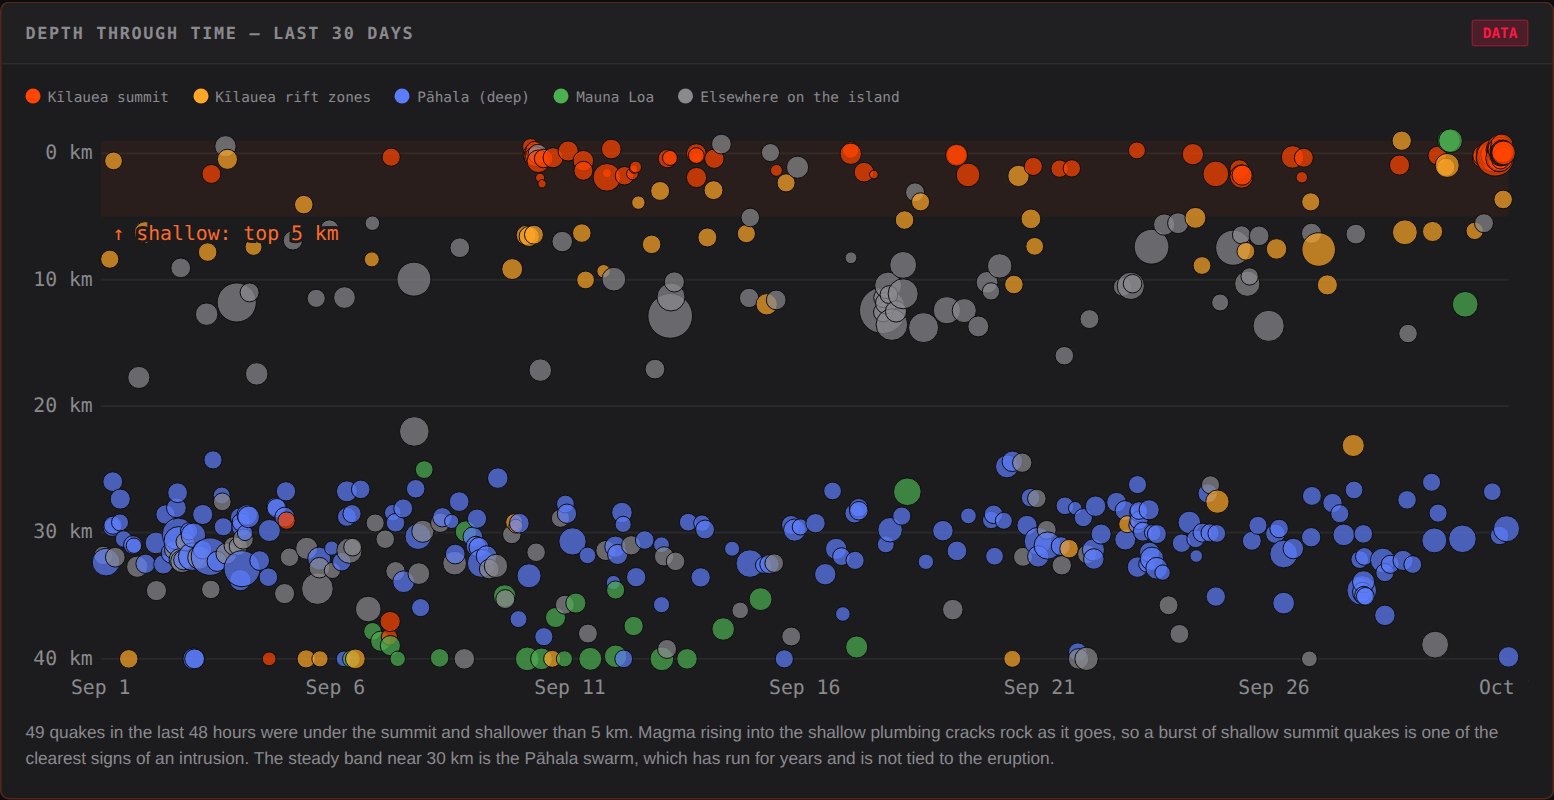
Depth through time, September 1 to October 1. The orange cluster at top right is the September 30 intrusion.
The Earthquakes tab has a new map too: quakes sized by magnitude and coloured by depth, the five volcanoes marked by alert level, with dark, satellite and topographic basemaps, and filters for region and for the last 24 hours, 7 days or 30 days.
Keeping it honest
The part I’m happiest with is the least visible. Every hour, the same GitHub Action that fetches the data now checks every webcam image and every USGS plot on the page, recording whether it loads and when USGS last updated it. It finds the list by reading the page itself, so I can’t add a camera and forget to check it. That’s how the frozen Mauna Loa camera turned up, and it’s why every camera on the site now wears a badge: “LIVE · 9 min ago,” or STALE, or OFFLINE.
The other change is a rule: if a USGS service is down when the Action runs, keep the last good file. Running the fetch script on a machine with no internet showed that the old version would happily replace the volcano list with an empty one.
What I’m watching
I built PELE for a trip. The forecast windows that made April so exciting are gone for now. What’s left is more interesting: a volcano in the middle of changing its mind, with the instruments showing it happen in real time. The next-episode card just counts the days. Whether it ends at 55, or with something else, the tiltmeter will show it first.
PELE is open source at github.com/bdgroves/PELE, live at brooksgroves.com/PELE. The original build post from April is here. All volcano data, plots and webcam images are from the USGS Hawaiian Volcano Observatory and are in the public domain; for anything that matters, their daily updates are the source of truth.
Go deeper
The Conversation: Hawaiʻi’s place in the Asia-Pacific; Chocolate and tourism — The Conversation (Hawaiʻi Public Radio), 2 October 2026, about 52 min. Includes the Volcano Minute with HVO geologist Katie Mulliken, two days after the intrusion.
Get the latest on Hawaiʻi’s volcanoes with the new ‘Volcano Minute’ — The Conversation (Hawaiʻi Public Radio), 17 July 2026, about 13 min. Katie Mulliken introduces HVO’s weekly audio update.
August 25, 2026: Timelapse video of Kīlauea episode 54 of lava fountaining from the V1cam — USGS Hawaiian Volcano Observatory, 25 August 2026, 39 sec video. Nine hours of the last fountain before the long pause.
Wilding, J.D., Zhu, W., Ross, Z.E. & Jackson, J.M. (2023). The magmatic web beneath Hawaiʻi. Science 379, 462–468.
Anderson, K.R., Poland, M.P., Johnson, J.H. & Miklius, A. (2015). Episodic deflation–inflation events at Kīlauea Volcano and implications for the shallow magma system. In Hawaiian Volcanoes, AGU Geophysical Monograph Series, 229–250.
Anderson, K.R., Johanson, I.A., Patrick, M.R. et al. (2019). Magma reservoir failure and the onset of caldera collapse at Kīlauea Volcano in 2018. Science 366, eaaz1822.
Volcano Watch: The ups and downs of episode forecasting using tilt data — Ingrid Johanson, 17 September 2026; why the forecast windows stopped working.
Volcano Watch: An intrusion during an eruption at the summit of Kīlauea — HVO, 1 October 2026; the September 30 swarm, straight from the source.
Characteristics of Hawaiian Volcanoes — USGS Professional Paper 1801, 2014; a free, book-length tour of the plumbing behind the sawtooth.
Kīlauea eruption information — the episode table PELE now reads every hour. · Kīlauea monitoring data — UWD tilt and GPS plots. · Mauna Loa — the neighbor next door.
HVO Volcano Minute — weekly audio updates. · USGS Volcano Notifications (HANS) — alert levels and notices. · USGS FDSN event service — where the depth plot’s quakes come from.
PELE live dashboard — the page itself. · PELE on GitHub — this project’s code.