In April 2018 I sent a cold email to a nonprofit I had never worked with.
I was finishing a GIS certificate at the University of Washington and looking for a volunteer project — something with real stakes, not another Portland light-rail bike-lane analysis. I had spent enough time in the Great Basin as a biology undergrad at Reno to have opinions about the high desert, and I had recently heard about the Oregon Natural Desert Association on an NPR story. They protect exactly the landscape I cared about. So I emailed their outreach coordinator asking if they had any GIS work a Seattle-based volunteer could do remotely.
Two weeks later, ONDA's riparian restoration coordinator, Jefferson Jacobs, wrote back with two project ideas. One involved Oregon Department of Transportation right-of-ways. The other was an idea he had been sitting on:
"This project uses a google-earth based engine (Not ARC GIS) to look at changes in NDVI over time for different locations. In eastern Oregon if imagery from August (or late July through early Sept…) is used (when there is little to no rain) the plants that are green and happy have tapped into ground-water sources and are a great indicator of ground-water extent. Our restoration efforts target the increase in groundwater so being able to map this extent is critical."
I want to sit on that idea for a moment, because I still find it beautiful eight years later. Eastern Oregon in late summer is a dead-dry landscape. It rains in the winter and it doesn't rain from July through September. Any plant that stays green in August has to be pulling water from somewhere, and in these drainages "somewhere" almost always means a shallow groundwater aquifer connected to the creek. Map the green pixels in August, and you have mapped the shape of the functional groundwater system. Do it every year, and you can watch groundwater expand or contract in response to whatever intervention ONDA is doing — beaver dam analogs, riparian plantings, channel-plug-and-pond, grazing exclusion.
Jefferson pointed me at three drainages where ONDA had been working: Hay Creek, Pine Creek, and the South Fork of the Crooked River. He said "I have no idea how to use this tool, so I need you to figure it out and then teach me."
I got a prototype working by fall 2018 in the Google Earth Engine Code Editor. It computed NDVI over each drainage from NAIP imagery, averaged it over polygons stored in a Google Fusion Table, and produced a screenshot of Pine Creek. Jefferson was happy. I moved on to a job in Seattle.
That was in 2018. This week I finally came back to finish it.
Why now, and what changed
Two things happened between 2018 and 2026 that made a rebuild worth doing.
The infrastructure moved on. Google Fusion Tables — where the site polygons lived — was shut down in December 2019. The GEE JavaScript editor is still fine for quick looks, but the Python geospatial ecosystem grew up. earthengine-api + geemap + xarray + geopandas is now the standard for anything reproducible. Landsat Collection 2 replaced Collection 1 in 2021, with cleaner geometry and radiometry back to 1984. Sentinel-2 started producing usable imagery in 2016 (10 m resolution vs Landsat's 30 m). Sentinel-1 SAR (2015 onward) added a completely independent moisture-sensing capability that doesn't care about clouds. pymannkendall and ruptures turned trend testing into two-line imports.
And the science question got better. NDVI was the right tool for a first pass, but the Normalized Difference Moisture Index (NDMI) — which uses the shortwave-infrared band to measure leaf water content directly — turned out to be a much more precise fit for the groundwater question Jefferson was really asking.
"NDVI tells you a plant is green.
NDMI tells you a plant is wet."
So the 2026 rebuild is not the 2018 tool with better graphics. It is a different analysis: 40+ years of Landsat, multiple indices, a completely independent SAR check, real statistics, and full reproducibility.
Code and data are public at github.com/bdgroves/onda-riparian-2026. MIT license. Anyone can clone it, run pixi install, authenticate to Earth Engine, and reproduce every figure in this post.
What we did
The pipeline is boring in the good way. For each of three ONDA study reaches:
1. Build one late-summer (Jul 15 – Sep 15) composite per year from 1984 through 2025 using every Landsat mission that was flying that year (5, 7, 8, 9). Apply proper cloud/shadow/snow masking. Rename bands to a common vocabulary so downstream code doesn't care which sensor produced the composite. Reduce to a single median value per polygon per year.
2. Compute NDVI, NDMI, NDWI, EVI, NBR on each composite.
3. Do the same for Sentinel-1 VV/VH backscatter, 2015 through 2024.
4. Run Mann-Kendall trend tests, Theil-Sen slope estimation, and PELT change-point detection on every index series.
5. Cross-check the optical (Landsat) moisture story against the radar (SAR) moisture story on the years where both exist.
The whole thing runs in about 10 minutes. Every intermediate result is a versioned CSV or GeoJSON in the repo. Every figure is regenerated from a script.
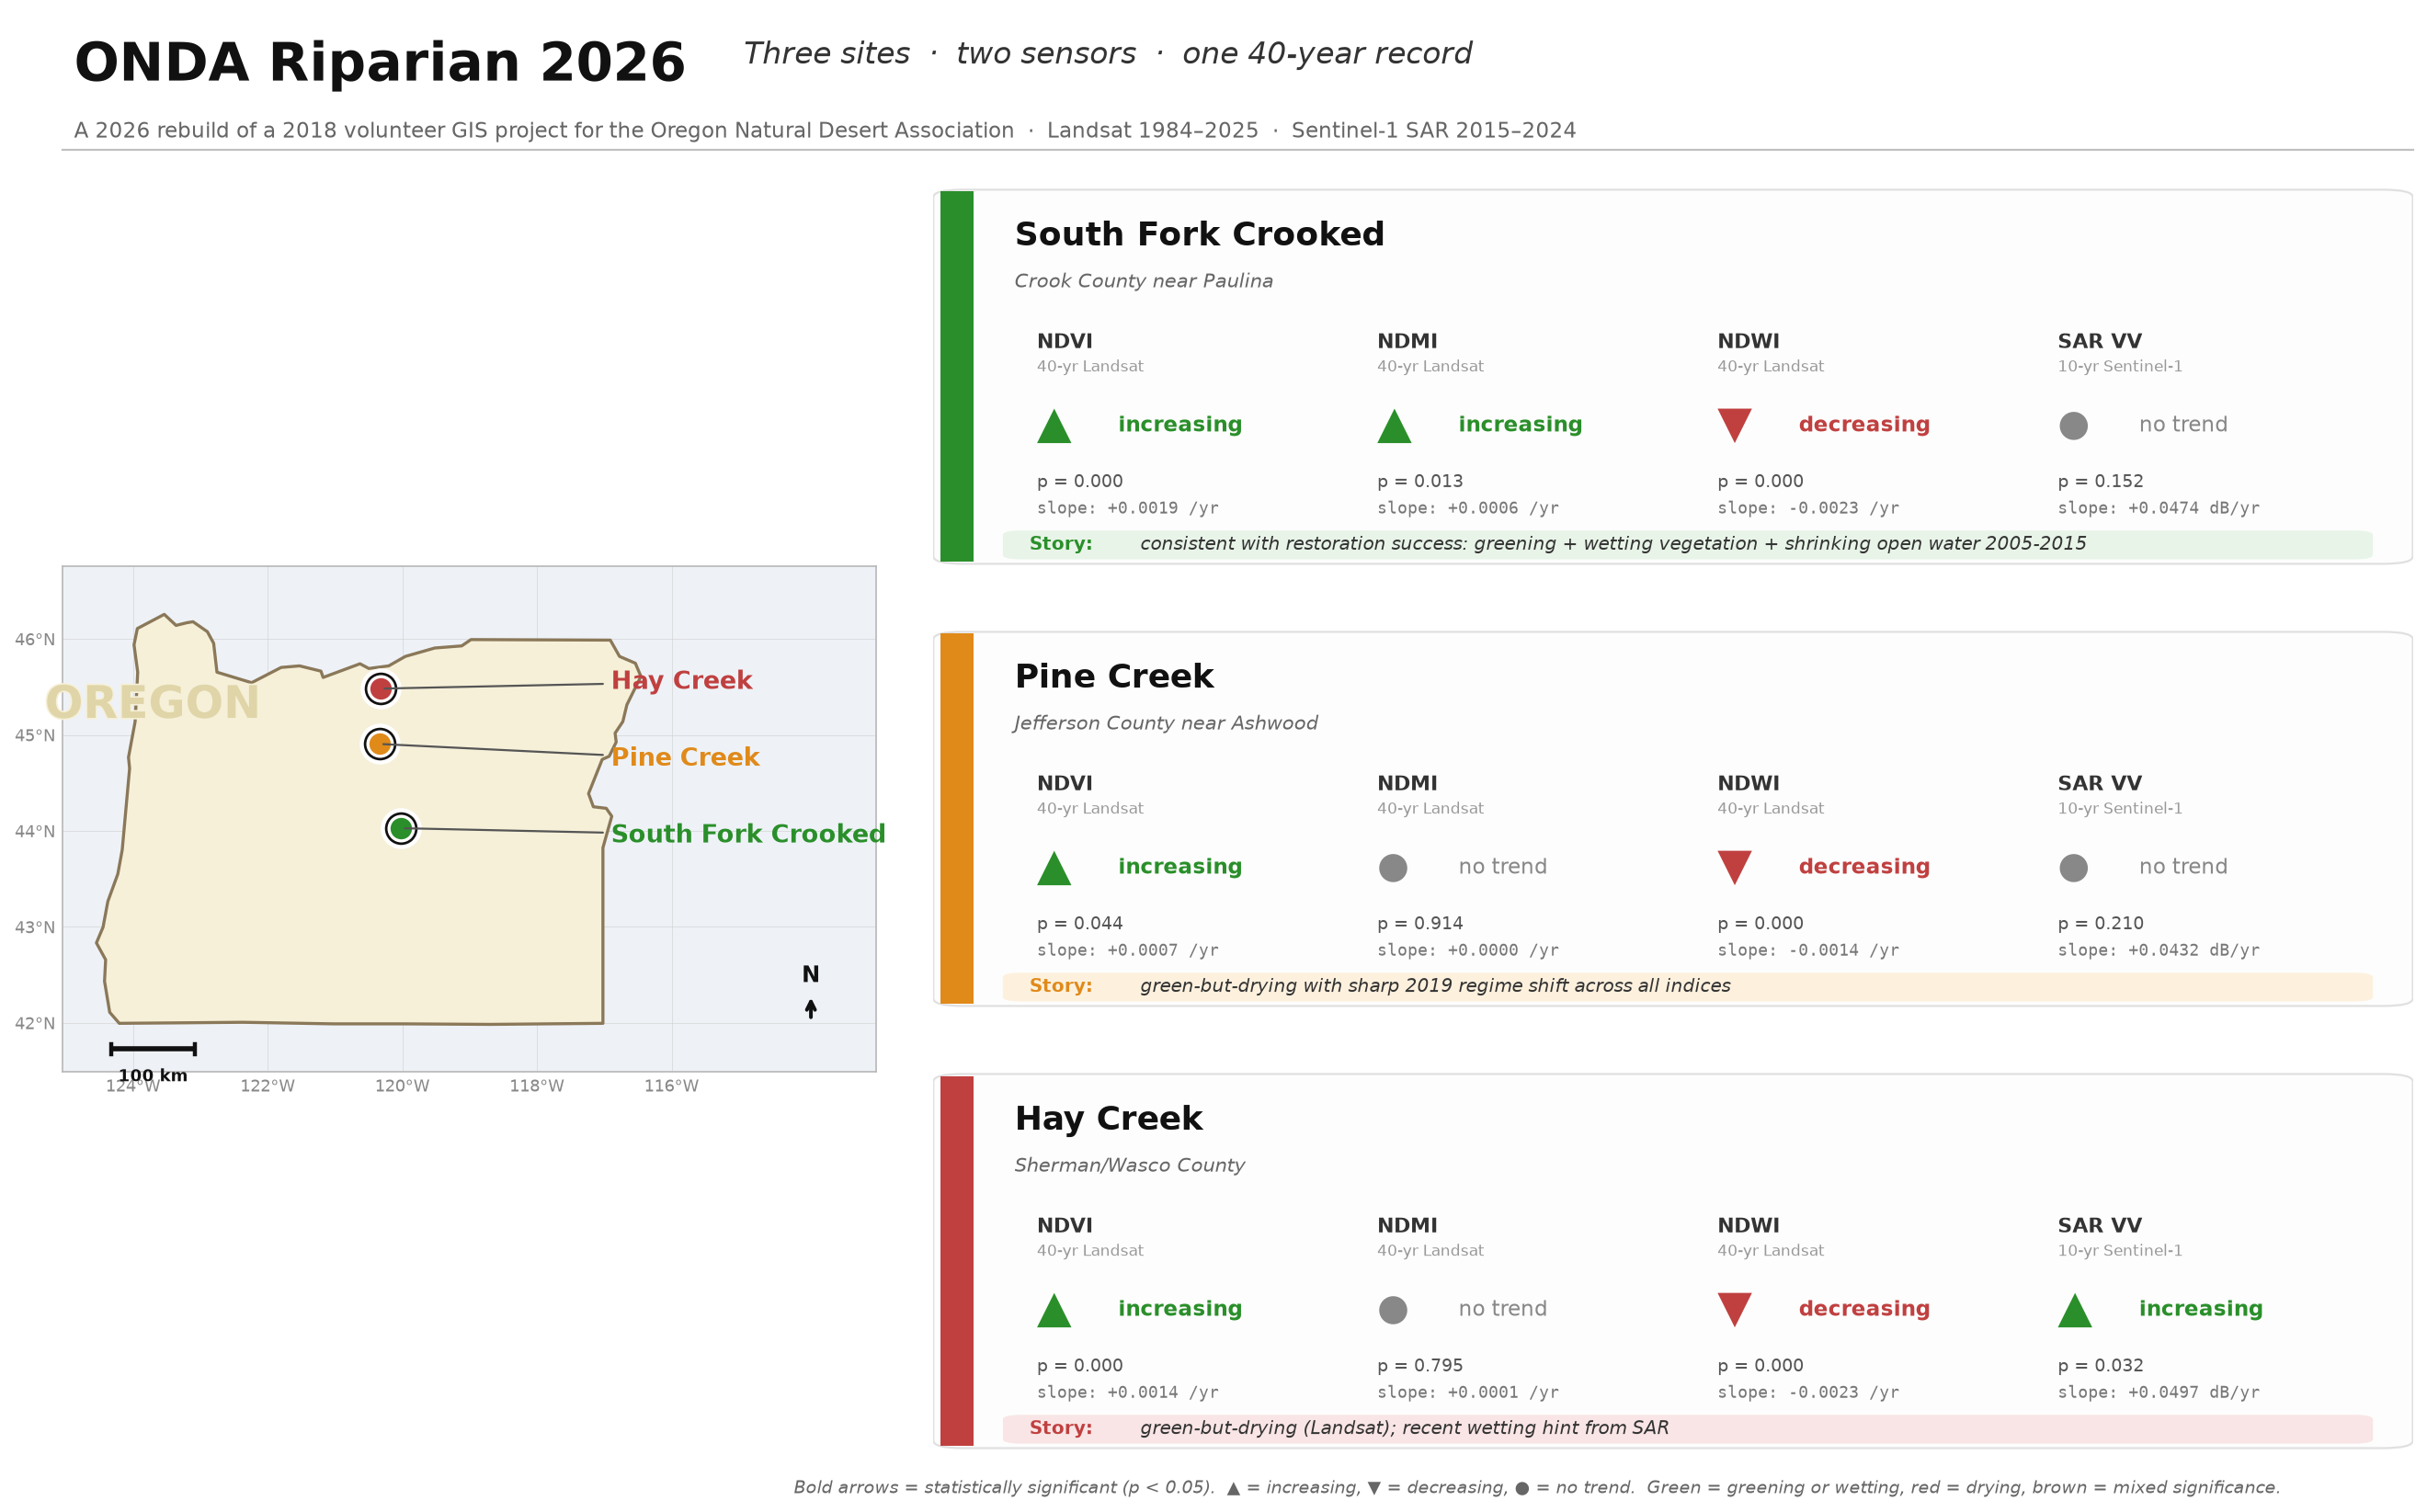
What the data says
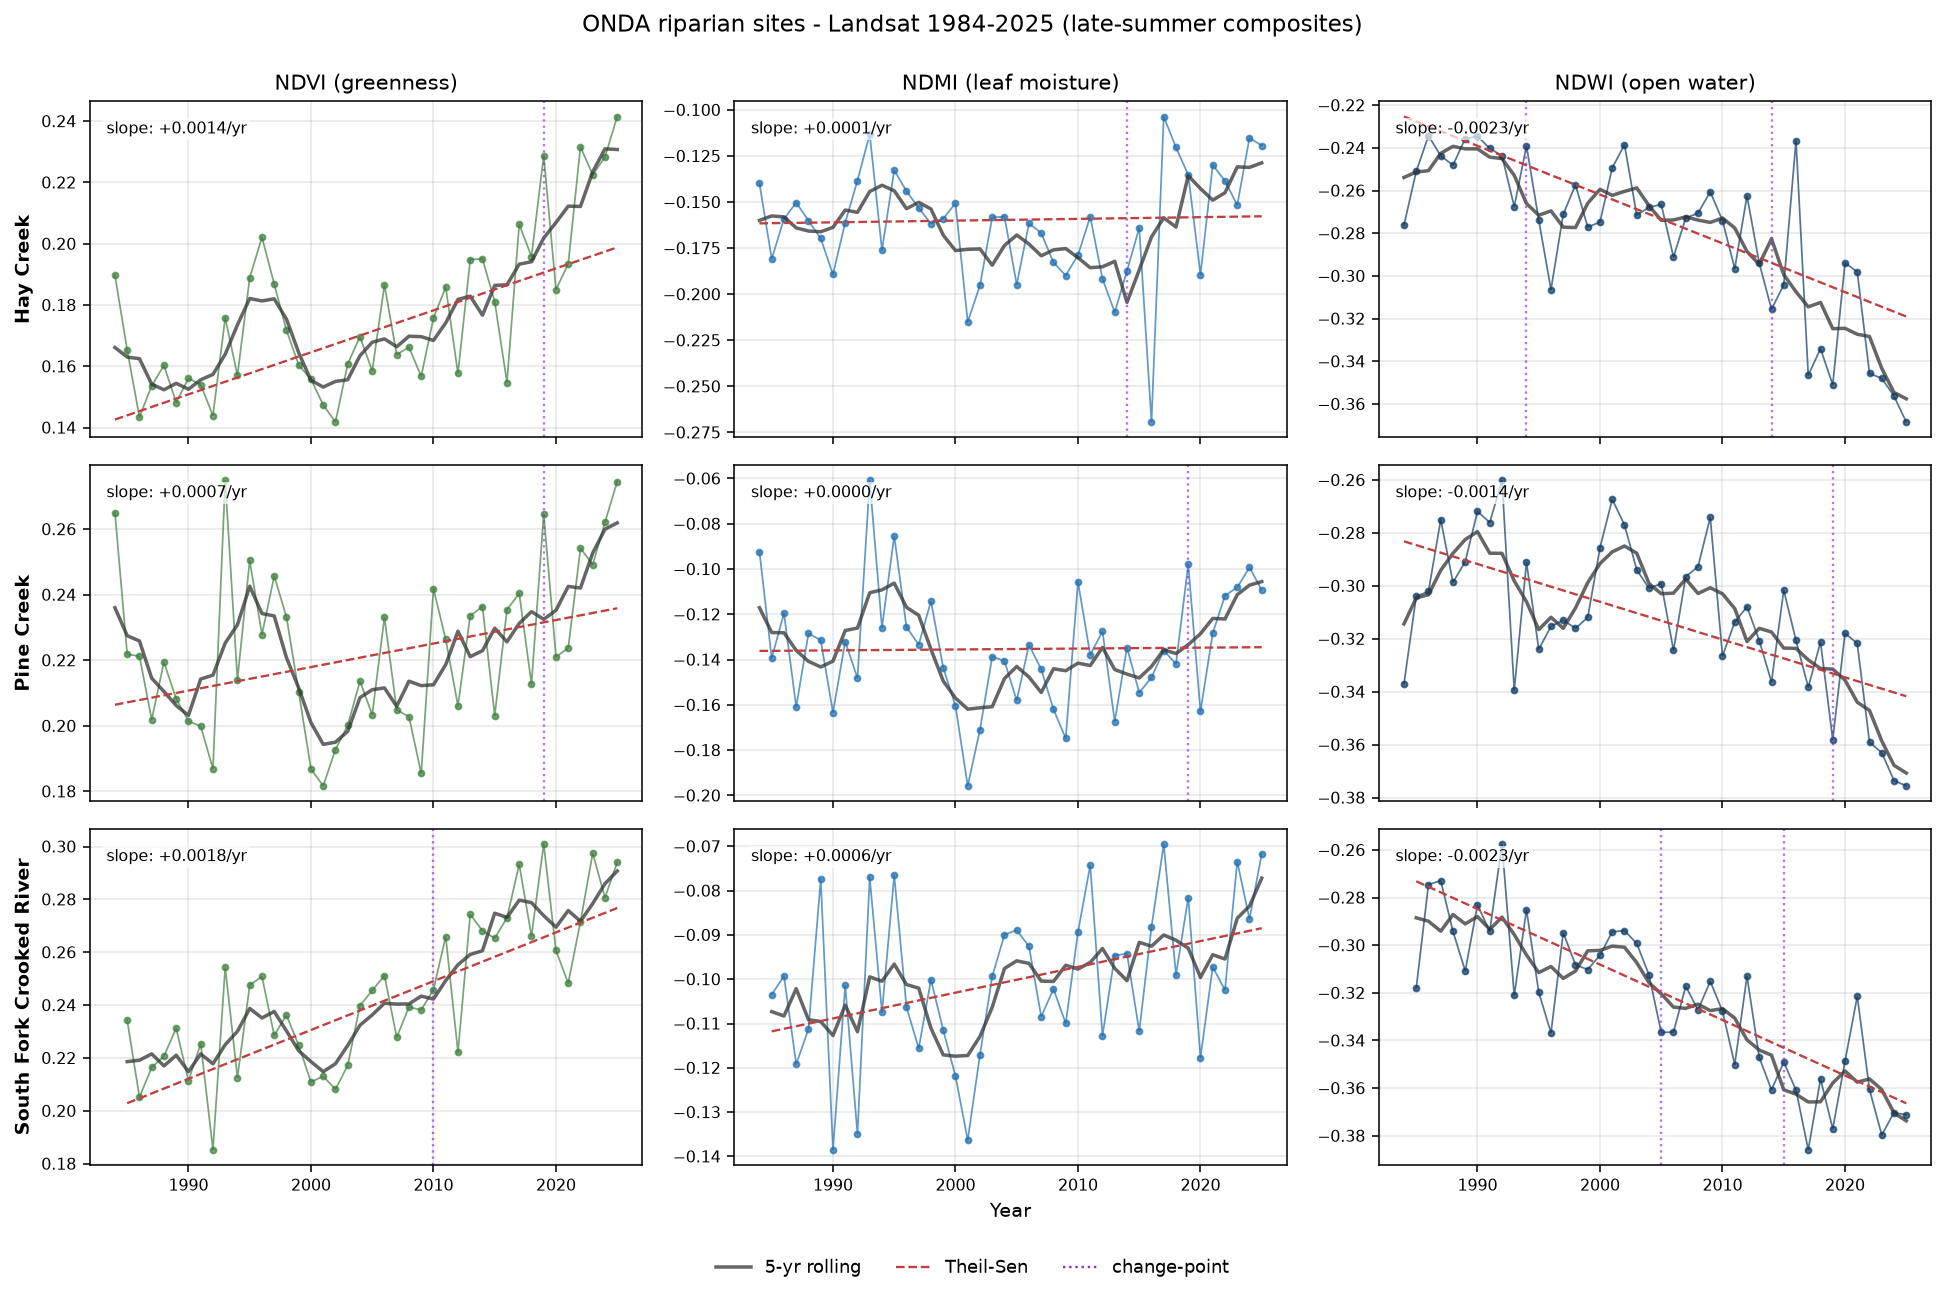
Three sites, three different stories. Here's the whole thing at once — every index, every site, every year from 1984 to 2025:
South Fork Crooked River — the most interesting
Every index at SF Crooked goes the direction restoration would predict, and the effect sizes are the largest of the three sites. NDVI is significantly increasing (p < 0.0001). NDMI is significantly increasing (p = 0.013). NDWI — open surface water — is significantly decreasing (p < 0.0001).
The temporal structure is even more interesting. The change-point algorithm finds an NDWI shift around 2005, an NDVI shift around 2010, and another NDWI shift around 2015. That's a decade-long transformation, not a single event. That is exactly the temporal signature you'd predict from a beaver dam analog network aging into the landscape — BDAs are cheap wooden structures that mimic beaver dams, and they take years to catch sediment, spread water laterally, and expand the wet footprint. If ONDA installed BDAs at SF Crooked in the 2005–2010 window, the data would look like this.
I don't know if they did. I emailed to ask.
Pine Creek — the 2019 regime shift
Pine Creek shows what a single-event signature looks like. All three Landsat indices have a change point in 2019, and the pattern is different from SF Crooked's slow decade-long shift. NDVI jumped, NDMI stayed flat, NDWI dropped — all in one year and stuck there.
That could be a lot of things. A restoration project completing. A wildfire. A grazing management change. A drought pattern shift. Only ONDA can tell me which.
Hay Creek — the two-sensor disagreement
Hay Creek is where the SAR analysis paid off. The Landsat record shows the same "green but drying" story as Pine Creek — NDVI up, NDMI flat, NDWI significantly down — with a 2019 change point in NDVI. On the Landsat evidence alone I would have said Hay Creek is drying out.
But Sentinel-1 VV backscatter at Hay Creek is significantly increasing over 2015-2024 (p = 0.032). Radar and optics see different things: optical NDVI/NDMI/NDWI respond mostly to leaf chlorophyll and structure, while C-band SAR responds to soil moisture and biomass volume. When they disagree, that disagreement is a signal.
The most honest read is that Hay Creek has been experiencing something recent that optical sensors can't fully see — likely a soil-moisture-level change under vegetation that doesn't itself look particularly wet. If I had to bet, I'd bet on grazing pressure changes or a subtle groundwater response, but I would not bet with much confidence.
The uncomfortable part
I am not going to overstate what this shows. It's real, it's reproducible, and it's from two independent sensors — but it is also hypothesis-generating, not conclusive.
Three specific limitations I want to name:
No ground truth. ONDA installed beaver dam analogs and did other work at various sites, but I don't yet know where or when. The single most useful piece of information I could get right now is a spreadsheet from Jefferson saying "SF Crooked BDAs installed 2008-2012 along these specific stream miles." With that in hand, the SF Crooked interpretation goes from "consistent with restoration success" to "predicted by restoration date." Without it, I'm guessing.
No control drainage. All three sites could be responding to regional climate — eastern Oregon has been warming and getting less reliable snowpack, which affects riparian systems everywhere in the high desert. A nearby, similar-sized drainage where ONDA has not done restoration would give me a control. If SF Crooked's wetting signal holds up against a drier climate-only trend at a control site, that's the causal-quality evidence.
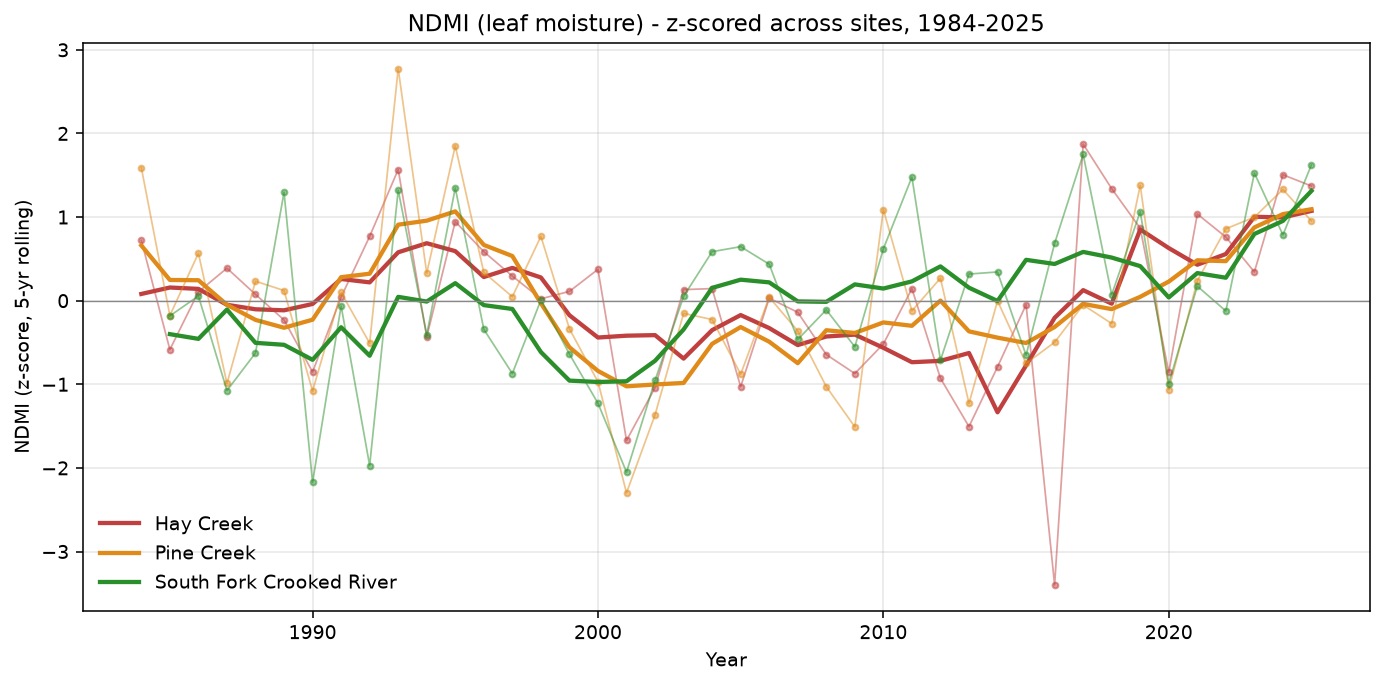
Something a normalized cross-site view can show, even without a true control, is whether the three sites are moving together or apart. If they were locked in step, you'd read that as "everything is climate." They're not:
Polygon means dilute local effects. SF Crooked's ONDA polygon is 6.7 km². If BDAs were installed on 200 meters of stream and had a huge effect there, that effect gets diluted 30-to-1 in the polygon mean. Pixel-level analysis (LandTrendr) is the natural next step — actually mapping which pixels changed the most and comparing that to project locations.
What I've learned
Three specific things.
Late-summer imagery is real signal, but late-summer averages hide event-scale change. The 5-year rolling means look smooth. The annual dots do not. Wildfire years, drought years, and specific restoration events show up as departures from the trend that you would completely miss if you only looked at the linear fit. If I do this again, I'll build a system that keeps both — the trend for the long story, the anomalies for the short one.
Two sensors is not twice as much as one sensor. It is qualitatively different. Landsat and Sentinel-1 disagree at Hay Creek because they physically measure different things (light bouncing off leaves versus microwaves bouncing off wet soil). The disagreement is more informative than agreement would be. Any future remote-sensing work I do that claims to detect environmental change should include an independent second sensor by default.
Reproducibility is not overhead. I spent probably 30% of the project time on pixi environments, tests, CI, gitignore rules, and documentation. That felt like tax at the time. But when I regenerated the whole analysis last week after finding a bug in the empty-year handling for SF Crooked, it took 12 minutes and I got the same numbers I got the first time. The tax paid for itself once, and it will pay again every time I revisit this or someone else picks it up.
What's next
If Jefferson replies, I'll do a follow-up post with the actual restoration dates layered on the change points. I have suspicions about the 2019 Pine Creek shift and about the mid-decade SF Crooked transformation, but I want to be told, not to guess in public.
Independent of that, there is another 2018 project in the same volunteer email — Jefferson asked me to identify where Oregon Department of Transportation road right-of-ways overlap with creek and river banks, so ODOT could plant shade vegetation without needing to acquire land. That is a totally different kind of analysis — public GIS layers, spatial intersections, aspect calculations — and it does not depend on ONDA ground truth. I'll do that one next and put it in the same repo.
And someday, a field trip. Every quantitative story wants a qualitative ground-truth visit. I want to stand at the SF Crooked BDA site in August 2027 and see whether the ground is actually wetter than it looks in Landsat. That's the trip I've been meaning to make since 2018.
Credits
None of this happens without Jefferson Jacobs at ONDA. He framed the science question in 2018, was patient with me when I disappeared for eight years, and is still doing the actual on-the-ground restoration work that this analysis pretends to measure. The polygons in the analysis are his. The insight about late-summer NDVI is his. I just added 40 years of Landsat.
Tooling credit goes to Qiusheng Wu at OpenGeos — his geemap library did most of the heavy lifting for the Earth Engine work, and his newer GeoLibre is where the next round of interactive maps for this project will live.
Full code, data, and figures at github.com/bdgroves/onda-riparian-2026. Questions, corrections, or ideas: brooks@brooksgroves.com.