I built lahar-watch in May. Mount Rainier is the mountain in my window from Lakewood, and the thing to worry about there isn’t lava. It’s lahars: slurries of rock, mud and water, like wet concrete, that pour down the river valleys. More than 90,000 people live in Rainier’s lahar hazard zones, and the USGS rates it a “very high threat” volcano largely because of them. I wanted a page that showed the network watching for them. Five months later I went back to do it properly, and found that almost none of the page was real.
What it was getting wrong
The seismogram was a drawing. The waveform scrolling across the top of the dashboard was random numbers, generated in the browser, with a sine wave added for texture. The “live seismic values” beside it were fixed numbers with a little random jitter. Nothing on that panel had ever touched a seismometer.
The stations weren’t the stations. It listed 13 “lahar monitoring stations” with IDs I’d made up, each pointed at a real station code. Several pointed at the wrong one. “Carbon River,” listed at 1,860 ft, was actually reading Camp Schurman, 9,439 ft up the other side of the mountain. “White River East” was Mount Fremont. “PUPY, Puyallup Valley” is Dog Mountain, 50 km away. And “nominal” meant only that the station appeared in the catalogue. It never asked whether a station was sending data. A station could have been dead for a year and still show green.
The rest was made up. The status page tested each data source in a way that couldn’t see what came back, so it said “reachable” whenever a server answered at all. The travel-time calculator used invented base times, and its multipliers ran backwards: picking “rapid onset” gave you more time to escape, and “slow build” gave you less. Some facts were wrong too. The Park Service approved new monitoring stations in April 2022, not October 2025. The Osceola Mudflow was 2–3 cubic kilometres, not 3.8. Rainier has sent at least nine large lahars into the lowlands in the last 5,600 years, not eleven in 6,000.
For a page about something that could kill people, that’s worse than a page about the weather being off. Everything below is real data, and I’ve tried to show where each number comes from.
The real network
The page now asks EarthScope (the old IRIS data center) for every seismic station within about 55 km of the summit in the two networks that watch Rainier: CC, the USGS Cascades Volcano Observatory, and UW, the University of Washington’s Pacific Northwest Seismic Network. Every hour it asks each one for its last hour of data. A station counts as reporting only if it actually delivered data in the last 20 minutes.
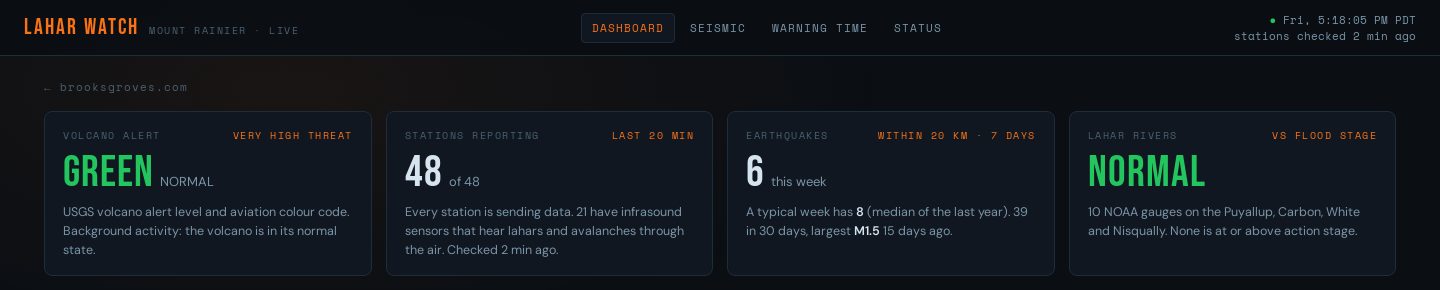
This evening: alert level normal, all 48 stations reporting, a quiet week of earthquakes, every river below flood stage.
Tonight that’s 48 stations, and all 48 are reporting. Twenty-one have infrasound arrays: microphones for very low sounds, which can hear a debris flow through the air as well as through the ground. Many are the lahar detection stations, set in the valleys where a flow would pass: Puyallup River 01–05, Tahoma Bridge and Mount Wow, which went into the lahar paths in 2022, Carbon River, and four new stations on the White River (Greenwater, Palisades, Sun Top and Lonesome Lake) since September 2025.
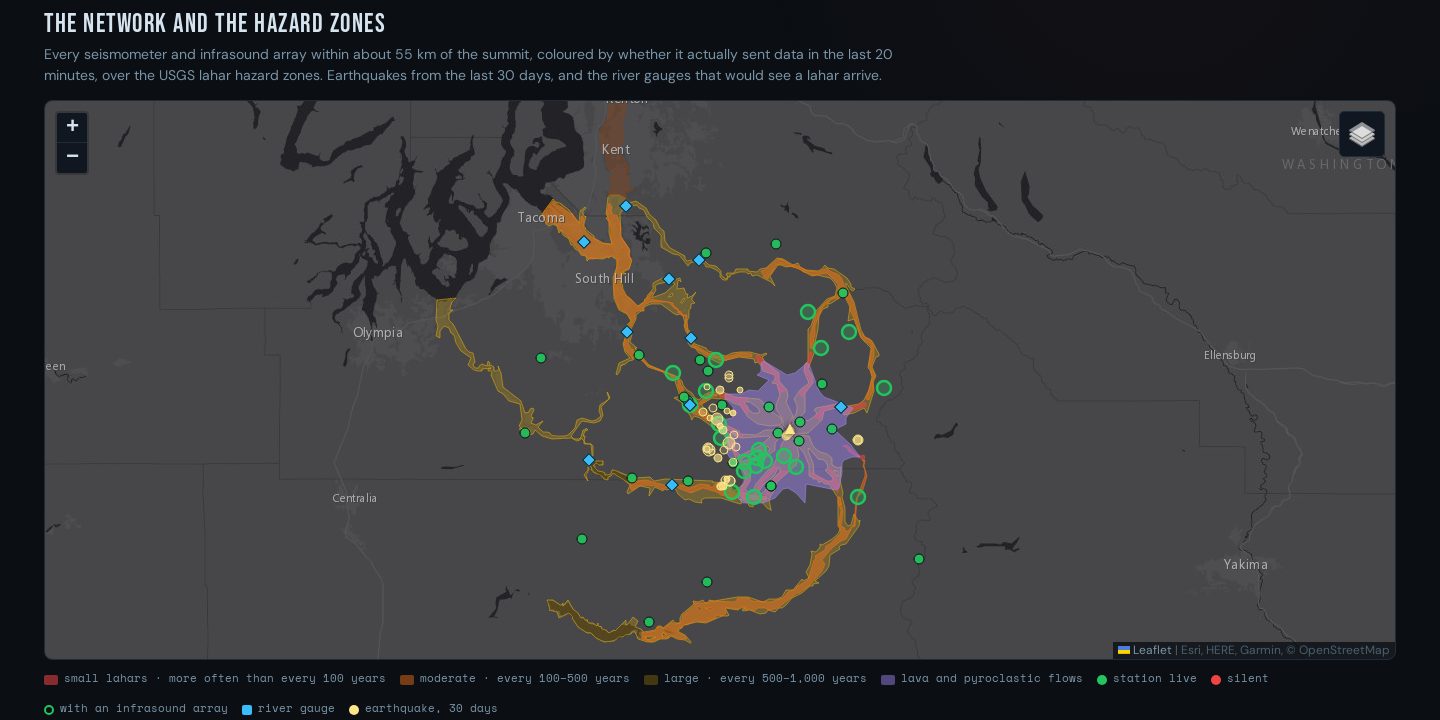
Stations (green, ringed if they have infrasound), the last 30 days of earthquakes, river gauges, and the USGS hazard zones. The orange and red reach Tacoma and the Kent valley.
The map’s hazard zones are the official USGS ones (Hoblitt and others, 1998), read from a public map service. That service also has a layer of parcels at risk, which I left out: those are people’s home addresses.
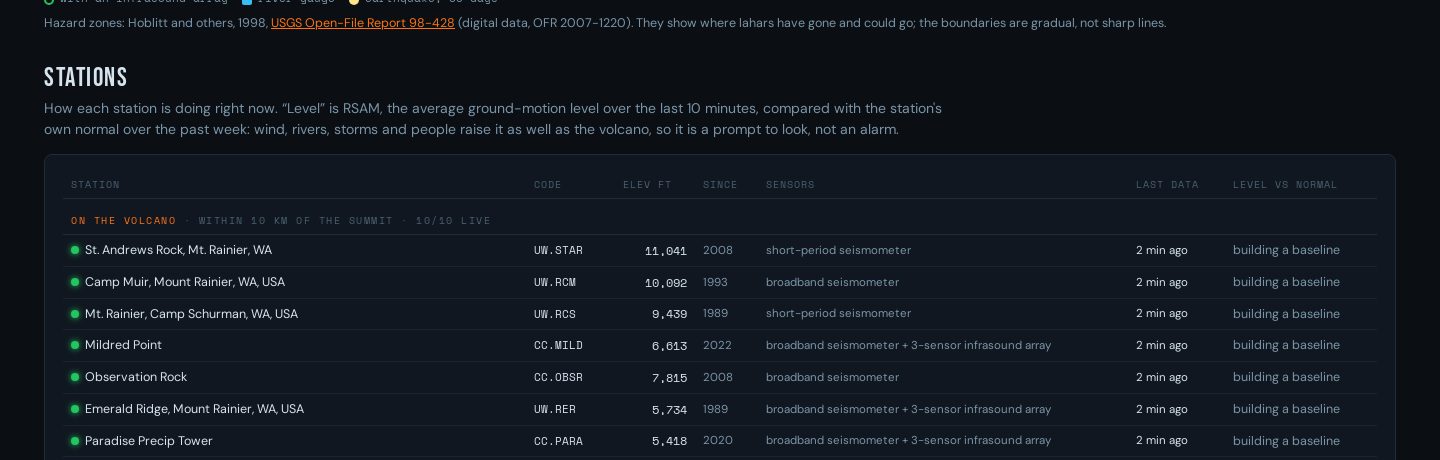
Each station with its real elevation, its sensors and when it last sent data, grouped from the summit down.
The last column is RSAM, the ground-motion level: the average shaking every 10 minutes, filtered to 1–10 Hz, compared with the station’s own normal over the past week. It needs a few days of history before it means much, and it rises with wind, rivers, storms and people as well as with the volcano, so the page calls it a prompt to look, not an alarm.
What the instruments hear
The seismic page draws 24-hour helicorders, the classic drum-recorder view, from the raw data: one line per hour, eight stations, one per drainage plus the summit. They’re worth a look side by side. Camp Muir, at 10,100 ft on the volcano, is busy all day with icequakes and wind. Tahoma Bridge, down in a lahar path, is a steady band of river noise. A lahar would look nothing like an earthquake: a long, swelling band lasting many minutes, showing up first on the stations high in the valley and then on the ones below.
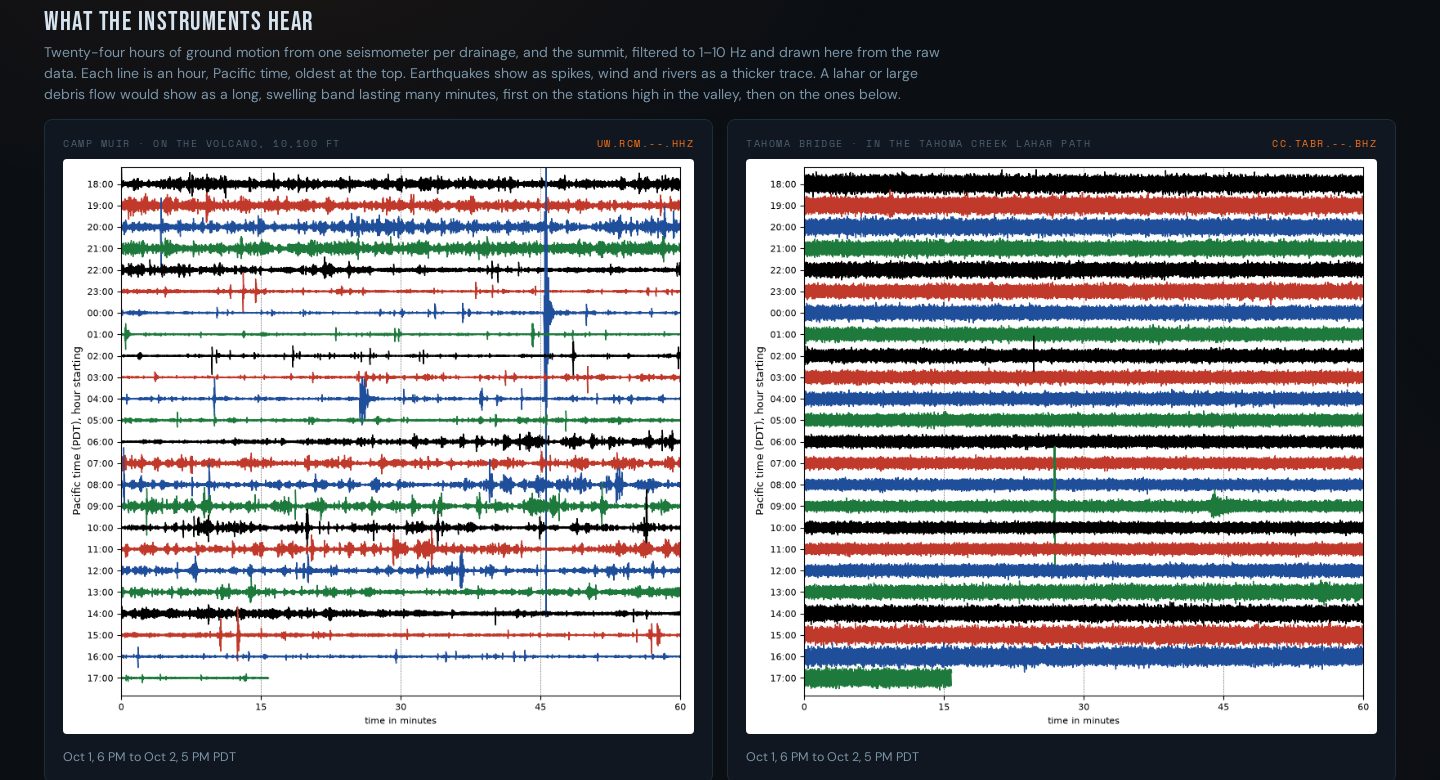
The last 24 hours at Camp Muir (left) and Tahoma Bridge (right), filtered to 1–10 Hz, Pacific time.
The swarm
Real data turned up a story the old page never mentioned. On July 8, 2025, Rainier started the largest earthquake swarm ever recorded there. At its peak there were about 40 earthquakes an hour, on average about 4.5 km beneath the summit. The USGS located more than 1,350, the largest a magnitude 2.4 on July 11. Within 20 km of the summit there were 849 in that first week alone. A typical week has about eight.
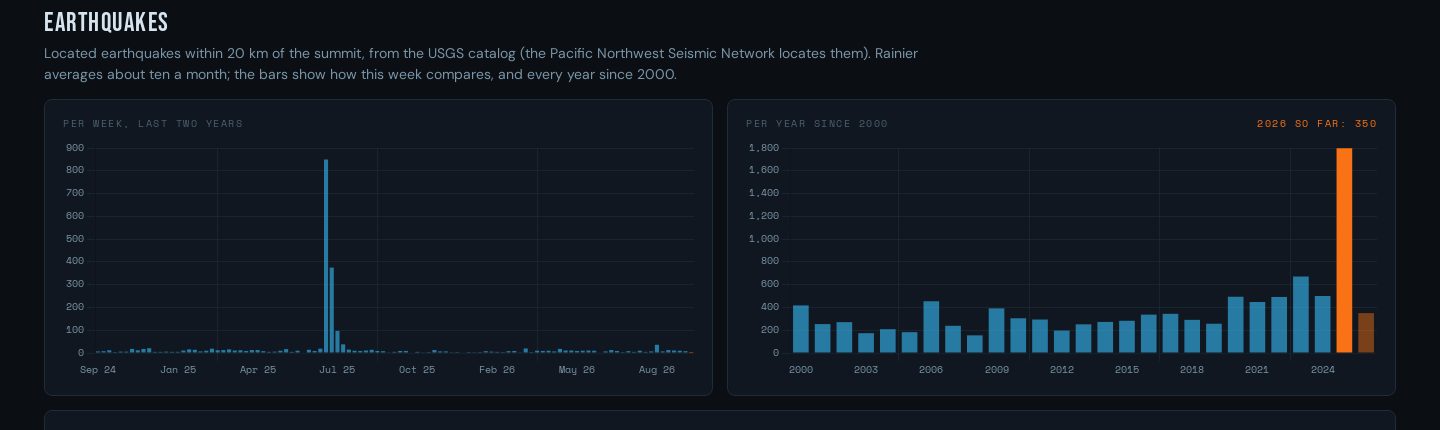
Per week for two years, and per year since 2000. The orange bar is 2025.
That makes 2025 the busiest year on record: 1,798 earthquakes within 20 km, against 150 to 500 in every year from 2000 to 2019. The years since 2020 have run a little higher, and some of that is probably the denser network catching smaller earthquakes. The alert level stayed green the whole time. The USGS tied the swarm to the hydrothermal system, the hot water above the magma, found nothing unusual in volcanic gas or ground movement, and on August 25, 2025 said activity was back to normal. The page now shows that notice in full, straight from the Cascades Volcano Observatory, and will show the next one when it’s issued.
The rivers
The page charts ten NOAA river gauges on the Puyallup, Carbon, White and Nisqually: the last seven days, NOAA’s forecast, and flood stage where NOAA sets one. Tonight they’re all low, at the end of a dry summer.
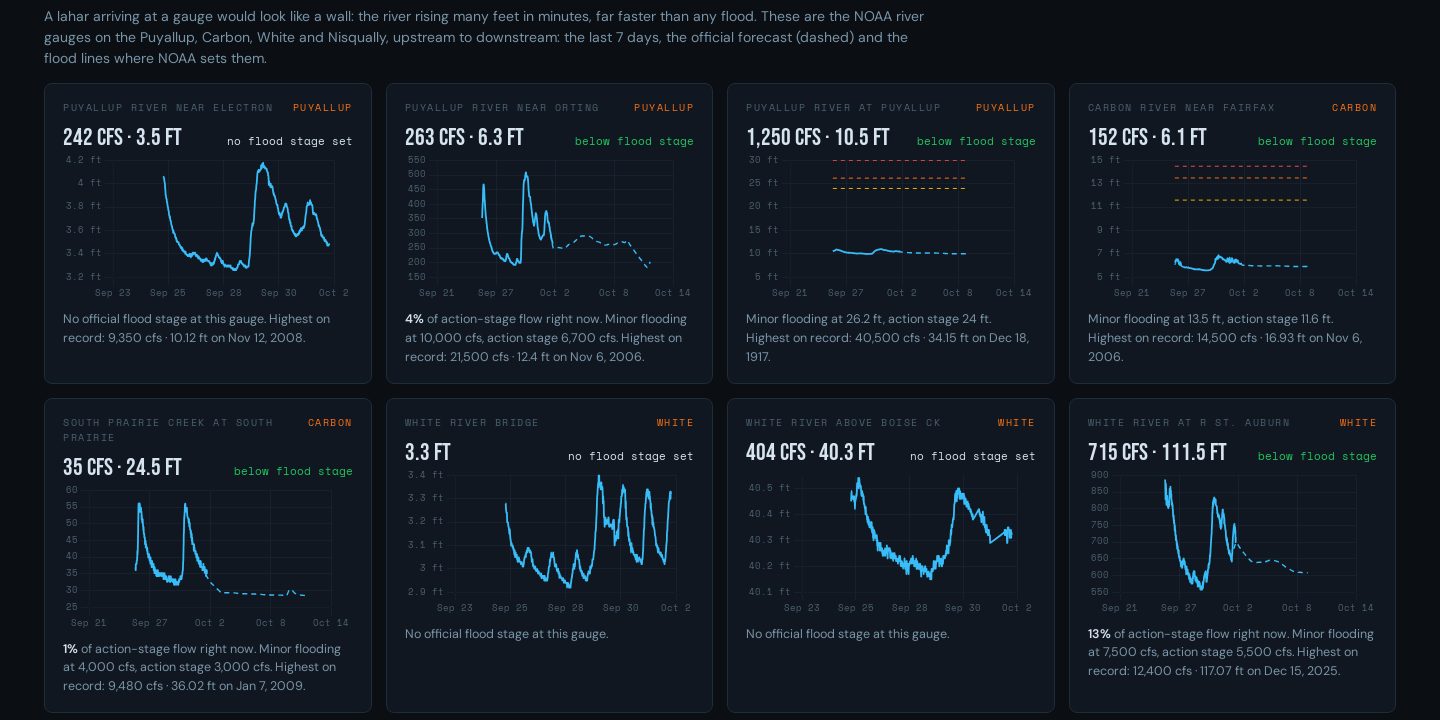
Seven days of stage or flow, NOAA’s forecast (dashed), and flood lines where NOAA sets them.
Last December they weren’t. The atmospheric rivers of December 2025 put the White River at Auburn to a new record, 12,400 cubic feet per second on December 15. The Puyallup at Orting peaked at 20,800 cfs on December 10, its second-biggest flow on record, and came within about half an inch of its record stage. The Carbon at Fairfax and South Prairie Creek both had their second-highest crests.
Even those floods rose over many hours and stayed high for days. That’s the point of putting the gauges here: a lahar would arrive at a gauge as a wall, the river rising many feet in minutes, far faster than any flood.
How much warning
The old calculator is gone. The warning page now gives the figures the USGS has published, with links: about 5 minutes for a lahar to reach homes inside the park, 15 to 60 minutes for those outside it, and 40 minutes to 3 hours of warning for most communities once a lahar is detected.
For the worst cases it uses the USGS’s 2022 computer simulations of the largest likely lahars from the weak, altered rock on Rainier’s west side: 260 million cubic metres, about the size of the Electron Mudflow of 500 years ago, which started as a landslide with no eruption. Starting from the Tahoma Glacier headwall, the flow reaches Ashford in about 20 minutes and the head of Alder Lake in about 50. Starting from the Sunset Amphitheater, it reaches the Orting lowlands in about an hour, arriving as a flow front about 4 metres deep moving at about 4 metres a second, 9 mph. That’s slow enough to outrun on foot, but only if you’ve already started.
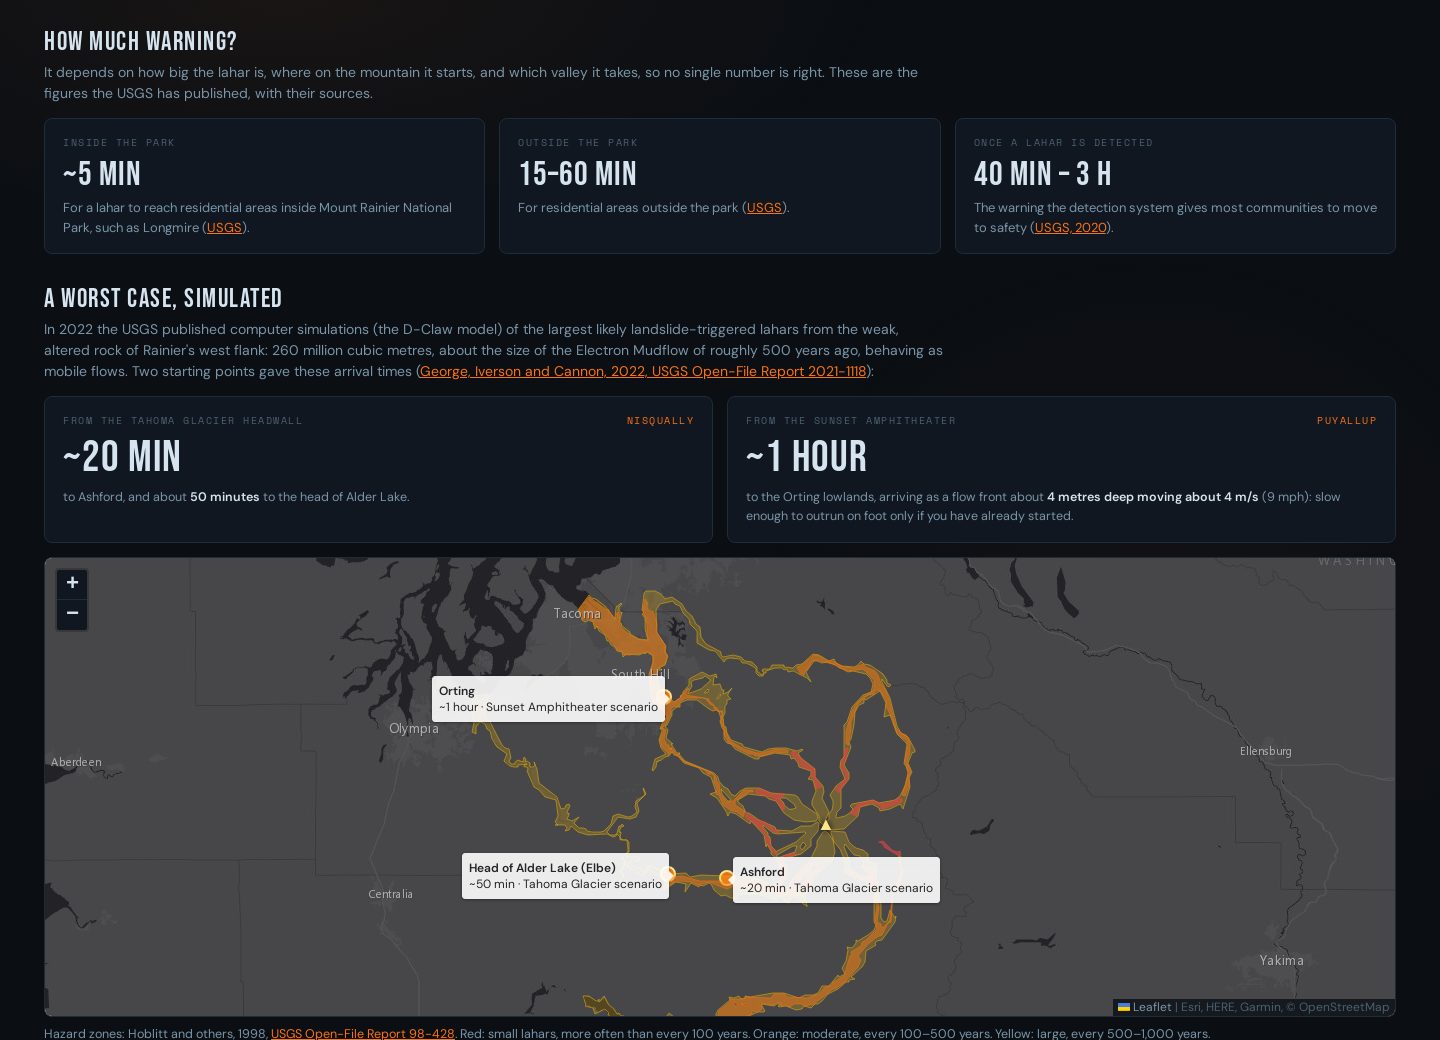
The published figures, and the USGS simulations on the map.
That’s why the detection stations exist. Their data reaches Washington Emergency Management and South Sound 911 within 10 seconds. The sirens go off from Orting to the Port of Tacoma, along with the Emergency Alert System, and the schools in the Puyallup valley practise walking to high ground every year. Walking, not driving: roads jam.
How it runs
A GitHub Action runs every hour at 17 minutes past. It reads the station catalogue and the last hour from every station, works out the ground-motion levels, draws the helicorders, and fetches the alert, the earthquakes and the rivers. The data goes to its own branch, replaced on each run, so the repo doesn’t keep thousands of commits of old readings. Your browser reads the alert level, earthquakes and rivers live from the USGS and NOAA, and the status page now really checks each source and shows what it returned. Everything is public and free: EarthScope, the USGS and NOAA, none of which need a key.
It’s still an independent view of public data, not a warning system. If the sirens go off, don’t check a website. Walk uphill, and follow Pierce County.
Sources: USGS, Monitoring lahars at Mount Rainier; USGS, Significant lahars at Mount Rainier; George, Iverson and Cannon, 2022, USGS Open-File Report 2021-1118; USGS on the 2025 swarm; Hoblitt and others, 1998, USGS Open-File Report 98-428; NOAA National Water Prediction Service crest histories. Code: github.com/bdgroves/lahar-watch.
Go deeper
Inside Mt Rainier’s most powerful seismic swarm on record — Think Out Loud (OPB), 31 July 2025, about 9 min. USGS geophysicist Alexandra Iezzi on why the July swarm was hot water, not magma.
Rainier seismic swarm update – July 14, 2025 — USGS Cascades Volcano Observatory, 14 July 2025, about 2.5 min video. CVO scientists and park geologist Scott Beason, mid-swarm.
Mount Rainier Lahars: Hazards for the Puyallup and Nisqually River Drainages — USGS, 26 April 2022, about 6 min video. The D-Claw simulations behind the travel times, animated.
What will happen when Mount Rainier erupts? — KUOW, Joshua McNichols, 24 May 2016, about 7 min. USGS geologist Carolyn Driedger on lahars and Orting.
Kramer, R.L., Thelen, W.A., Iezzi, A.M., Moran, S.C. & Pauk, B.A. (2024). Recent expansion of the Cascades Volcano Observatory geophysical network at Mount Rainier for improved volcano and lahar monitoring. Seismological Research Letters 95(5), 2707–2721.
Vallance, J.W. & Scott, K.M. (1997). The Osceola Mudflow from Mount Rainier: sedimentology and hazard implications of a huge clay-rich debris flow. Geological Society of America Bulletin 109(2), 143–163.
Finn, C.A., Sisson, T.W. & Deszcz-Pan, M. (2001). Aerogeophysical measurements of collapse-prone hydrothermally altered zones at Mount Rainier volcano. Nature 409, 600–603.
Reid, M.E., Sisson, T.W. & Brien, D.L. (2001). Volcano collapse promoted by hydrothermal alteration and edifice shape, Mount Rainier, Washington. Geology 29(9), 779–782.
Sisson, T.W. & Vallance, J.W. (2009). Frequent eruptions of Mount Rainier over the last ~2,600 years. Bulletin of Volcanology 71(6), 595–618.
The Rainier volcanic hazards detection system has been growing — EarthScope, Hayley Bricker, 12 August 2024; a friendly tour of the new valley stations.
USGS: Mount Rainier — alert level, updates and hazard science. · USGS Cascades Volcano Observatory — the CC network’s home. · PNSN: Mount Rainier — the UW network’s view of the mountain.
EarthScope FDSN station service — where the station list comes from. · ObsPy — the Python toolkit behind the helicorders. · NOAA National Water Prediction Service — river stages, forecasts and crest histories.
Washington Emergency Management: Volcanoes — getting ready if you live in a valley. · Mount Rainier National Park — the mountain itself.
lahar-watch live dashboard — the page itself. · lahar-watch on GitHub — this project’s code.