Hydrologists start the year on October 1. It’s the end of California’s dry season, the point where the rivers are as low as they get and the next winter hasn’t started, so every water year is named for the September it ends in. Water year 2027 began this morning. It begins with an El Niño Advisory in effect: the Oceanic Niño Index hit +1.8 for June through August, and NOAA’s September outlook gave better than 90% odds of a very strong event this winter.
That seemed like a good reason to go back to Sierra Streamflow, the dashboard I built in March to watch eight USGS gages on the Merced, Tuolumne and Stanislaus. I hadn’t looked at it in a while. The timing turned out to be almost too good: the dashboard’s “this year” line had disappeared overnight.
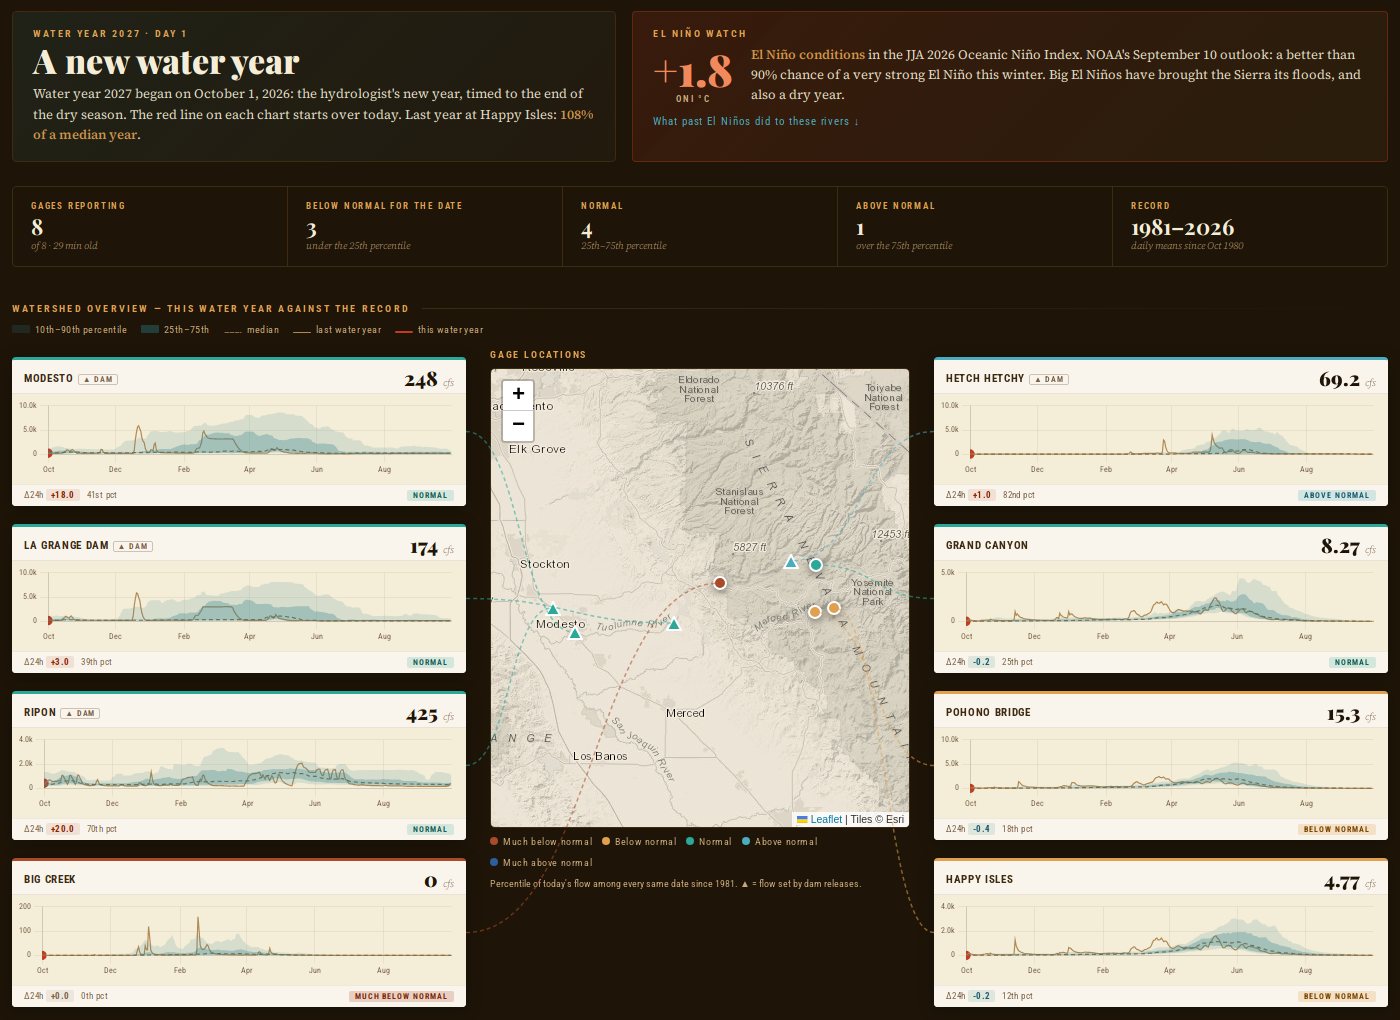
October 1, 2026, day one of water year 2027. Each chart shades the range of every year since 1981; the red line starts over today.
What had drifted
- The year rolled over and the chart went blank. The fetcher asked USGS for “October 1 to yesterday” of the current water year. At 2:29 this morning that became October 1 to September 30, an empty range. The historical record was also hard-coded as 2005 to 2024, so water years 2025 and 2026 never made it into the comparison at all.
- The status labels didn’t mean anything. Every gage used the same thresholds: over 200 cubic feet per second was “elevated,” over 5,000 was “flood.” That called the Tuolumne at Modesto elevated on an ordinary fall afternoon, and it would have called a 16-square-mile creek normal in the middle of its biggest flood.
- Some stations were in the wrong place. My registry had the Grand Canyon of the Tuolumne gage below Hetch Hetchy and several miles off; it’s above the reservoir, which is the whole point of it. The valley gages were listed hundreds of feet too high.
- It downloaded twenty years of history every hour. About 160 requests per run, to rebuild data that changes once a year.
- The API it uses is being shut down. USGS plans to decommission its legacy WaterServices in the first quarter of 2027.
The fix
The fetcher now works out the water year from the date, and keeps each gage’s full daily record since October 1980 in a small cache that it refreshes weekly and whenever a year completes. The hourly run only asks for the last week and the current and previous year, which is a handful of requests. It uses the new USGS Water Data APIs, with the old service as a fallback until it goes away. Station details come from USGS’s own site metadata.
Status is now a percentile, the way USGS’s old WaterWatch did it: today’s flow compared with the same date (plus or minus three days) in every year since 1981. Below the 10th percentile is much below normal; above the 90th is much above. Each chart draws those bands, so you can see at a glance whether a river is running like a dry year or a wet one. And the four gages below dams carry a small ▲, because their flow is a release schedule, not the weather.
Water year 2026, in review
The dashboard now closes out each year. At Happy Isles, the gage on the Merced above Yosemite Valley with nothing upstream but granite and snow, water year 2026 came in at 108% of a median year: about 244,000 acre-feet. The surprise is the timing. Half of the year’s water had passed Happy Isles by April 12, about a month earlier than usual and the earliest of any year since 1981, even though the single biggest day didn’t come until May 13. A lot of the year’s water ran off in winter rather than waiting for the spring melt.
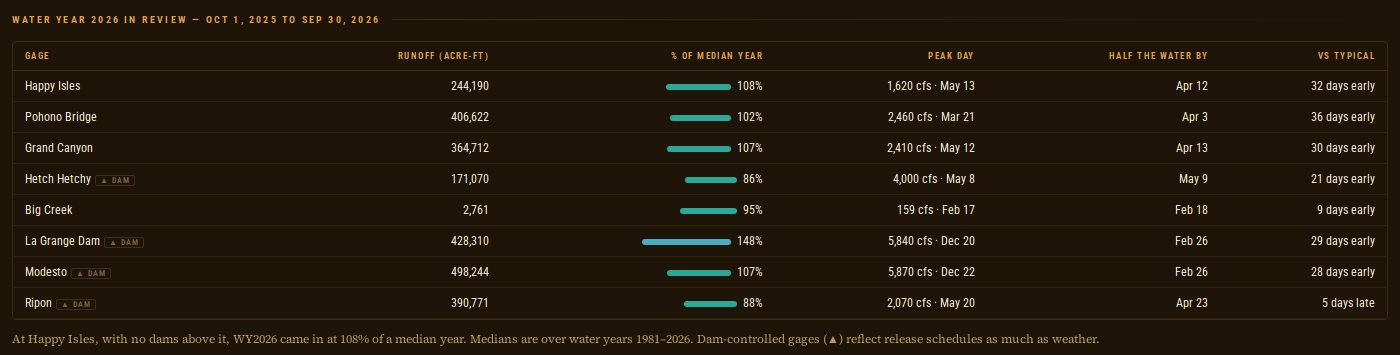
Water year 2026 at all eight gages. The dam-controlled gages (▲) mostly tell you about release schedules.
What El Niño has meant for these rivers
El Niño’s reputation in California comes mostly from two winters: 1982–83 and 1997–98. Both were very strong events, and both flooded the state. That reputation is fair in Southern California. The central Sierra sits closer to the hinge between El Niño’s wetter south and drier north, and the record shows it.
At Happy Isles, the five strong and very strong El Niño winters since 1981 produced:
| Water year | Winter ONI | Runoff, % of median |
|---|---|---|
| 1983 | +2.1, very strong | 256% |
| 1992 | +1.5, strong | 64% |
| 1998 | +2.2, very strong | 189% |
| 2016 | +2.5, very strong | 118% |
| 2024 | +1.8, strong | 116% |
Their median is 118% of a typical year, against 98% for La Niña winters and 88% for neutral ones. So the odds lean wet. But 1992 was a drought year in the middle of a strong El Niño, and the 2015–16 event, one of the strongest on record, delivered an only slightly above-average year. The two biggest years at Happy Isles since 1981 weren’t El Niño years at all: 2017 (neutral, 280%) and 2023 (La Niña, 255%), the winters of the Oroville spillway and the giant Sierra snowpack.
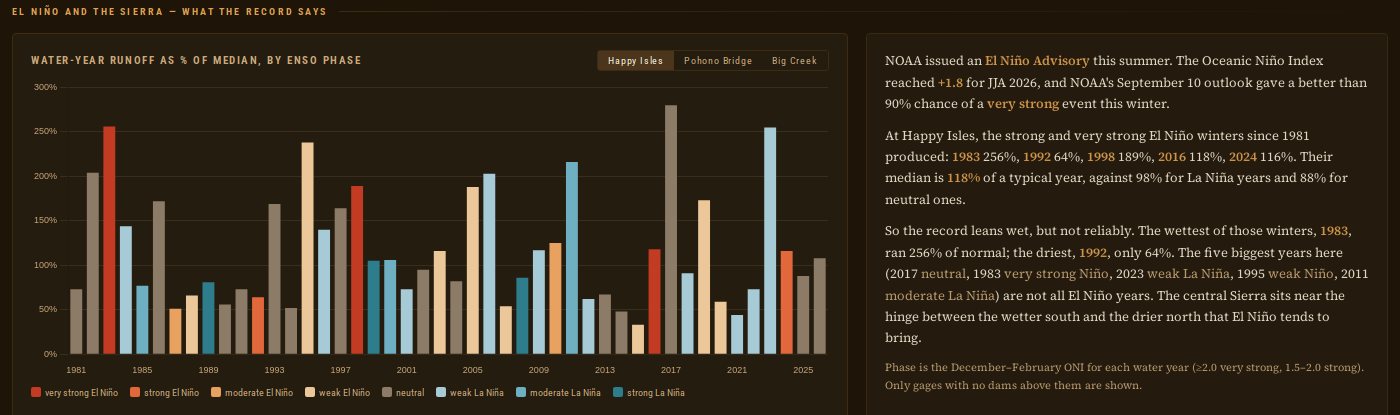
Every water year since 1981 at Happy Isles, coloured by that winter’s ENSO phase. The tall red bars are 1983 and 1998.
An El Niño this strong makes a wet winter more likely. It doesn’t make one certain, and it says little about whether the precipitation arrives as snow or rain.
When the snow lets go
One more chart, because the data was sitting right there. For each water year, it plots the day half of that year’s water had passed Happy Isles. In a snow-fed river, that date follows the melt. The trend over 46 years is about 2.8 days earlier per decade, roughly two weeks since the early 1980s. The year-to-year swings are much bigger than that, so it’s a lean, not a rule. Water year 2026, at April 12, was the earliest in the 46-year record.
Watching this winter
Right now every river on the dashboard is at its autumn low, and Big Creek, the little creek near Groveland where I grew up, is dry, as it usually is by October. The first big storm will show up at Happy Isles within hours. The red lines start from zero today, and the bands show where they would have to climb to make this an El Niño winter people remember.
Sierra Streamflow is open source at github.com/bdgroves/sierra-streamflow and live at brooksgroves.com/sierra-streamflow. The original build post is from March. Data from USGS Water Data for the Nation and the NOAA Climate Prediction Center.
Go deeper
This year’s ‘super’ El Niño could be a preview of life on a much warmer Earth — Here & Now (NPR/WBUR), 30 September 2026, about 4 min. Grist’s Frida Garza on why forecasters are calling this winter’s event a “super” one.
TILclimate presents: What the heck is El Niño, anyway? — TILclimate (MIT, from NHPR’s Outside/In), 9 November 2023, about 21 min. A friendly primer on what El Niño is and how to tell its fingerprints from climate change’s.
Yosemite Nature Notes 8: Snow Line — Yosemite Nature Notes (National Park Service), 1 March 2010, about 9 min video. Why the elevation where rain turns to snow moves with every storm — the very thing El Niño can’t promise.
Redmond, K.T. & Koch, R.W. (1991). Surface climate and streamflow variability in the western United States and their relationship to large-scale circulation indices. Water Resources Research 27(9), 2381–2399.
Cayan, D.R., Redmond, K.T. & Riddle, L.G. (1999). ENSO and hydrologic extremes in the western United States. Journal of Climate 12(9), 2881–2893.
Stewart, I.T., Cayan, D.R. & Dettinger, M.D. (2005). Changes toward earlier streamflow timing across western North America. Journal of Climate 18(8), 1136–1155.
Dettinger, M.D., Ralph, F.M., Das, T., Neiman, P.J. & Cayan, D.R. (2011). Atmospheric rivers, floods and the water resources of California. Water 3(2), 445–478. Open access.
Jong, B.-T., Ting, M. & Seager, R. (2016). El Niño’s impact on California precipitation: seasonality, regionality, and El Niño intensity. Environmental Research Letters 11, 054021. Open access.
NOAA Climate.gov ENSO Blog — years of warm, plain-English posts from the forecasters themselves on how El Niño works (and when it doesn’t).
USGS 11264500, Merced River at Happy Isles — the snow-fed gage behind the El Niño and melt-timing charts. · USGS Water Data APIs — the new home the fetcher now talks to.
NOAA CPC Oceanic Niño Index — the season-by-season table that colours every bar. · ENSO Diagnostic Discussion — the monthly outlook and advisory. · CW3E at Scripps — atmospheric-river forecasts for watching the first big storms roll in.
Sierra Streamflow — the live dashboard. · bdgroves/sierra-streamflow — the code.