I built Weather Station in April, before my coffee was finished: four places that matter to me (Lakewood, the Sierra foothills where I grew up, Reno and Death Valley), one dark instrument panel, zero dollars. The original post said it updated every 15 minutes. Six months later I went back to make it the best weather station I could, and the first thing I found was that it wasn’t really a weather station at all.
What it was getting wrong
None of it was measured. The big number at the top of the page, “current conditions,” came from Open-Meteo’s forecast model: its best estimate of what the weather probably was, not a reading from a thermometer. Models are good, but they aren’t observations, and they miss things like fog, low cloud and a calm night in a valley.
And it wasn’t current. The GitHub Action was scheduled for every 30 minutes, not every 15 as I’d written. GitHub doesn’t promise scheduled runs, and at busy times of the hour it quietly drops them. Over the last month, 193 updates actually ran out of the 1,440 scheduled. The typical gap was about three and a half hours, and the longest was eight. Every one of those runs also committed a new copy of the data to the repo: about 2,400 commits since April.
This morning both problems showed up at once. At ten o’clock the page said Lakewood was 47° and clear. That was the model’s estimate for 6 a.m., four hours earlier. At the same moment McChord Field, two miles away, was reporting 63° and overcast at 3,000 ft.
A few smaller things, while I was owning up. The 3-hour pressure trend compared readings from the wrong hours, because it mixed a UTC clock with local times. The hourly forecast started at midnight, so by evening most of it was in the past. And Death Valley was listed at −282 ft. That’s Badwater Basin; the weather station at Furnace Creek is at −190 ft.
Measured first
The page now reads the weather itself, in your browser, every five minutes: the latest observation from the nearest National Weather Service station, with how old it is and which station it came from. The model’s value sits beside it as a check, and anything that still comes from the model (the sky at stations without a ceilometer, pressure at stations without a barometer) is labelled model.
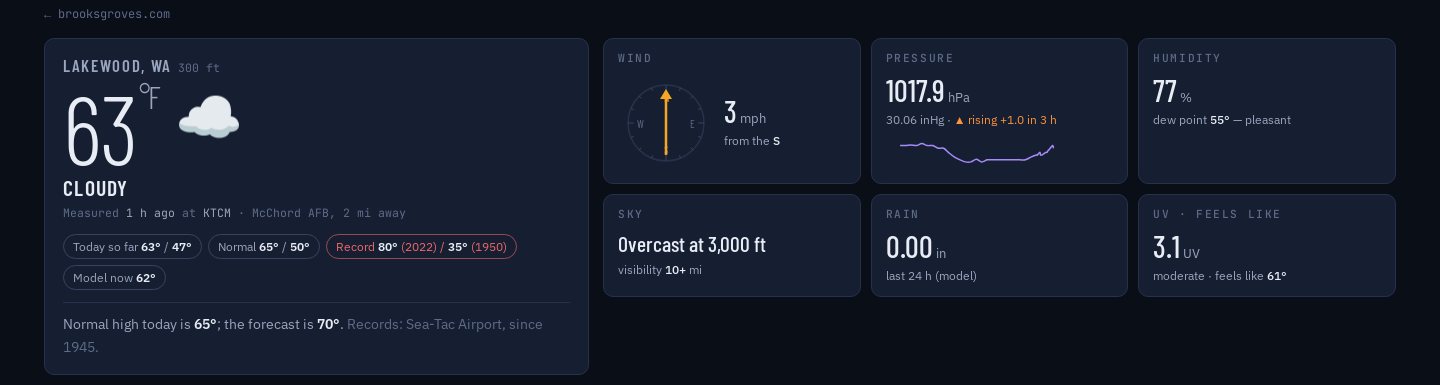
Lakewood this morning, measured at McChord AFB. The chips underneath show today so far, the normal and the record for the date, and what the model thinks.
Lakewood, Reno and Death Valley have stations close by: McChord AFB, Reno–Tahoe airport and the Furnace Creek visitor center. The foothills are harder. The original page showed Groveland, my hometown, which has no official station; the nearest is the Mount Elizabeth fire-weather station, 15 miles off and about 2,100 ft higher. So the foothills station is now Sonora, the county seat, whose own records go back to 1903. It has no National Weather Service station in town either, so the readings come from the Green Spring fire-weather station, 12 miles away and about 700 ft lower, a much closer match than a ridge-top. The page says so, rather than pretending.
A GitHub Action still runs every hour, at 23 minutes past to stay out of the busy top of the hour, and keeps a backup copy for when a source is down. It only commits every three hours now. If the page has to fall back to the backup, it says so in the corner.
Measured, then forecast
The charts are the part I like best. Each one has the last 24 hours as the station recorded them (a solid line), then the forecast for the next 48 (dashed), with the normal range for the date behind them. The two lines meet at now, so you can see at a glance whether the forecast is starting from the right place.
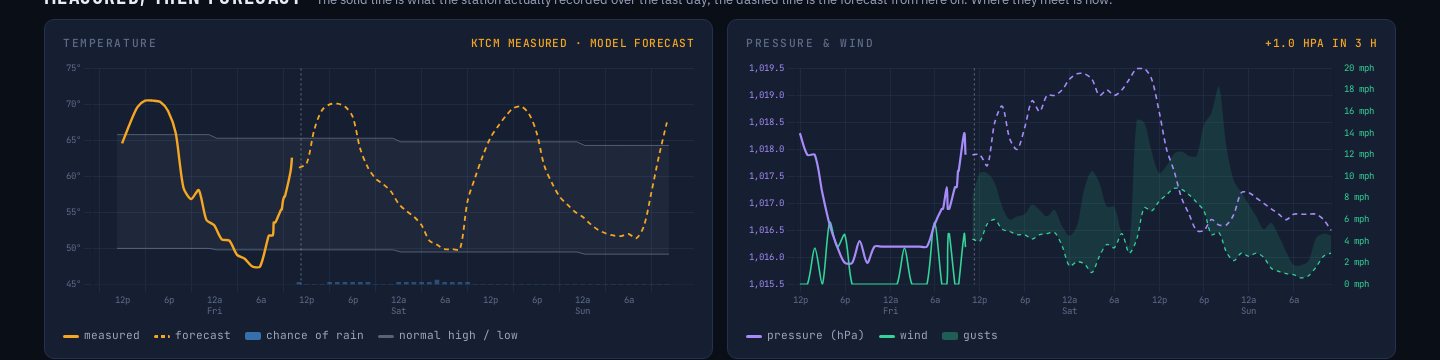
Lakewood: the solid lines are McChord’s readings, the dashed lines the forecast. The pressure forecast is shifted to start from the station’s own reading.
The measured lines are honest, which means they’re sometimes strange. Lakewood’s pressure sat at exactly 1016.2 hPa for seven hours overnight. I checked the raw reports before believing it; it really did. At Mount Elizabeth, the ridge-top station I first tried for the foothills, the temperature barely moved all night, 68 to 70° from midnight until dawn, more than 20° above the normal low in town. That’s probably the thermal belt: on a calm night cold air drains into the valleys, and a slope a couple of thousand feet up can stay warmer than the town below.
From the forecaster
The National Weather Service writes its own forecast in words, and the page now shows it for the next few days next to the model’s seven-day cards. Every few hours a meteorologist at the local NWS office also writes an Area Forecast Discussion: what the atmosphere is doing, and how sure they are. The page shows the synopsis, with the full discussion one click away. It’s the best weather writing there is, and it’s free.
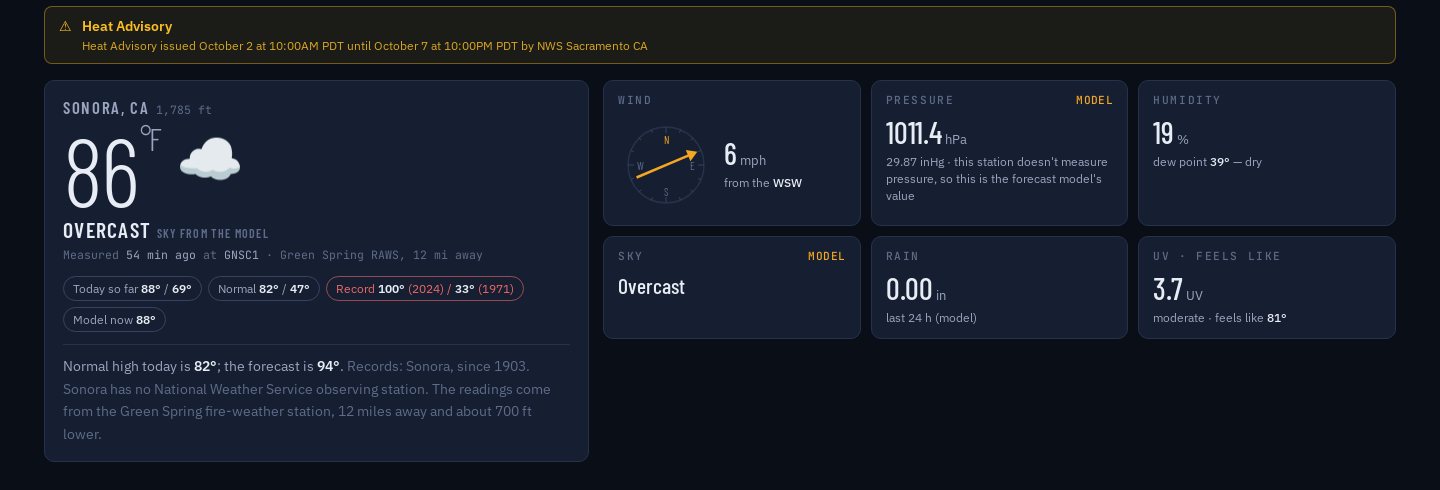
Sonora today: a Heat Advisory through October 7. The normal high for the date is 82°; the forecast is 94°, six short of the record.
Today the Sacramento office has a Heat Advisory out for the foothills, Sonora and Groveland included, and the discussion explains why: highs 10 to 20 degrees above normal through Tuesday. Up in Lakewood the Seattle office’s note this morning was about more cloud than expected knocking a couple of degrees off the high. That cloud was the 63° and overcast the old page was calling 47° and clear.
How good is the forecast?
A forecast shown without a track record is asking to be taken on faith, so the page now keeps score. Open-Meteo archives what its forecast said one to seven days ahead for every hour, back to March, which meant the scoring could start with 200 days of history instead of from zero. Every morning the hourly job compares those forecasts with the high and low each station actually measured, and with two guesses any forecast ought to beat: “it’ll be the normal for the date” and “same as it was N days ago.”
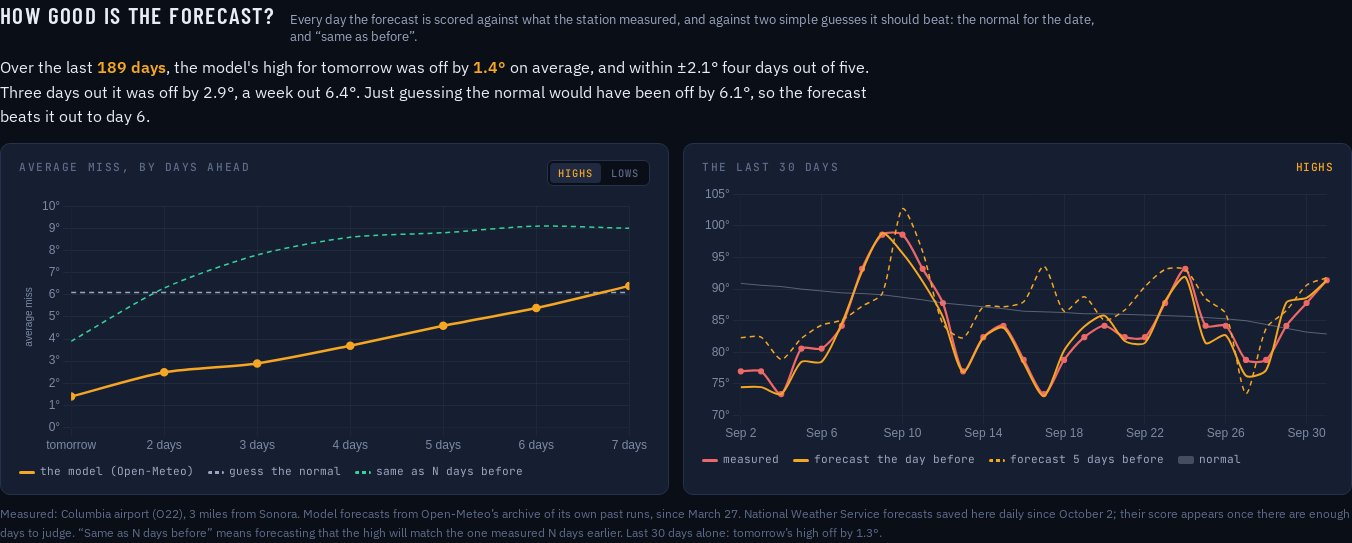
Sonora, scored against Columbia airport three miles away: tomorrow’s high is off by 1.4° on average, and the forecast beats guessing the normal out to day six.
The results are honest in a way the forecast itself isn’t. In Sonora tomorrow’s high is off by just 1.4° on average, and in Death Valley 1.5°: clear, dry air is easy to forecast. In Reno it’s 2.7°. In Lakewood it’s 3.7°, running about 3° cool, and by day seven the forecast is barely better than guessing the normal (6.0° against 6.2°). The lows tell a different story in the foothills: Sonora’s forecast lows run 8° too warm. On calm, clear nights cold air drains off the hills and pools in the low ground, and the model, which sees the terrain only in rough outline, forecasts something closer to the hillside: 72° forecast and 57° measured on September 24, against 51° and 48° on the 28th.
A correction, and a bad thermometer. The first version of this section scored Sonora against the town’s co-op weather station and said tomorrow’s high was off by 3.8° and the lows ran 13° warm. Both were wrong, because the station was. Checking one odd number for the freeze card (below), I found it had logged lows of 33–37° for seven nights in mid-September while Columbia airport, three miles away, logged 48–55°, and every other station within 25 miles agreed with Columbia. It had even set a false record low for September 18. The co-op station also misses about a third of its days. So Sonora’s forecasts are now scored against Columbia airport, and the record books for all four stations get a neighbor check: any recent day where a station disagrees with every station around it by more than 12° is set aside. At Sonora that removed 6 highs and 40 lows from the last 400 days; at the other three, none.
Each forecast day now carries a “usually ±” figure from these scores. The National Weather Service’s own forecast isn’t archived anywhere I can reach, so the page has started saving it every morning; once there are a few weeks of it, the human forecasters go on the same chart as the model.
Against the record books
“94° in October” means more with something to compare it to. Once a day the Action now pulls each station’s full daily history from ACIS, the NOAA Regional Climate Centers’ database, and works out the 1991–2020 normal and the record high and low for every date of the year. The records come from the longest nearby history, not the nearest station: Sea-Tac since 1945, Sonora since 1903, Reno since 1893 and Death Valley since 1911.
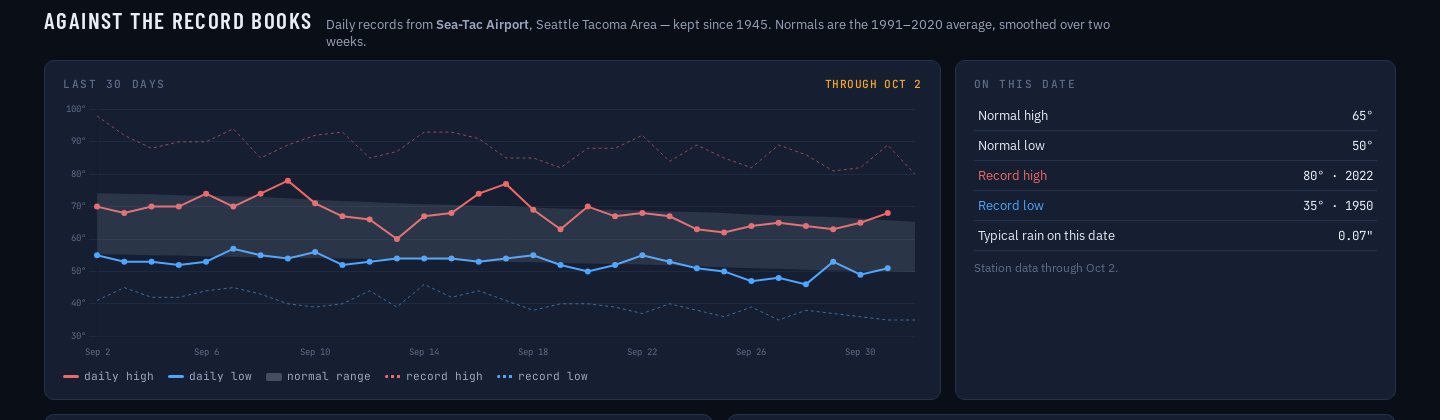
Sea-Tac’s September: highs mostly inside the normal band, nowhere near the records (dotted).
Every forecast card now has the normal for its date underneath and a flag if the forecast reaches the record. There’s month to date against normal, and rain since October 1, the start of the water year, against what usually falls by now. And the Death Valley page carries the number everyone wants: 134°F, at Greenland Ranch (now Furnace Creek) on July 10, 1913, still the highest air temperature on record anywhere. Today it’s forecast to reach 104°, three above normal and nine short of the record for October 2.
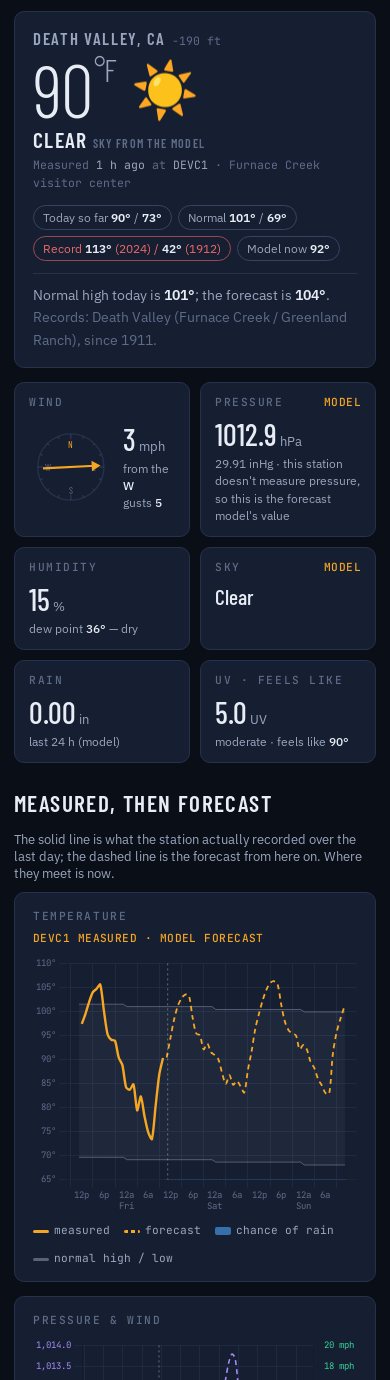
Death Valley on a phone. 105° yesterday afternoon, 73° at dawn.
Anywhere in the US
The four stations are mine, but the page doesn’t have to stop there. Type a town or a ZIP into the search box, pick from the suggestions, and it builds the same panel for that place, with its own link: the nearest stations, the local forecast office and its discussion, alerts, the forecast and air quality.
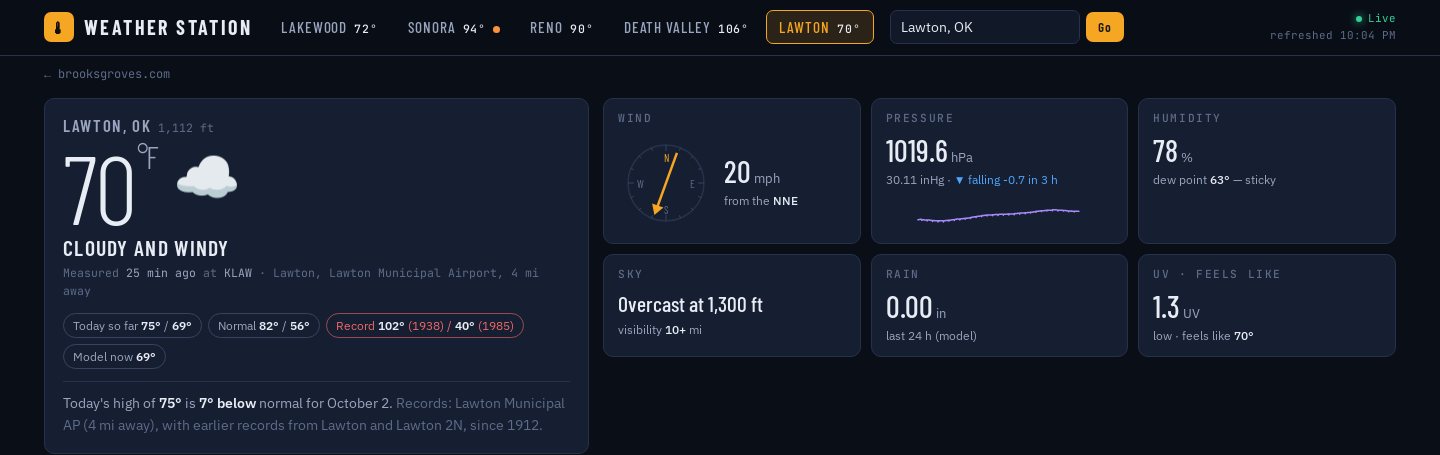
Lawton, Oklahoma, the afternoon a cold front came through: 70° and windy at the airport, pressure falling, the day’s high 7° below normal.
Search got its own round of fixes after the first version went out. It only worked if you pressed Enter, so I added suggestions as you type, a Go button and a plain message when a place can’t be found. Searching one of the four home towns opens its own tab. And when I searched Lawton from my own computer it said “showing the model only,” while the same search worked fine from GitHub’s servers. Something between my machine and the Weather Service was blocking it. That’s a reminder that a page which fetches its data live is only as good as the visitor’s connection.
So the page now has a second source. If the National Weather Service doesn’t answer, it reads the same station reports, forecast discussions and active alerts from the Iowa Environmental Mesonet, Iowa State’s long-running public archive of Weather Service data, and says so beside the reading. It also retries the Weather Service, which often fails the first time anyone asks about a new place, and stops waiting on it for a few minutes when it’s clearly unreachable.
Records for anywhere
Searched places now get the record books too. The page asks ACIS for the nearest current station that reports both temperature and rain, preferring one within ten miles that covers the 1991–2020 normals, and builds the normals and records in the browser the same way the overnight job does for the home stations.
The interesting part is that a town’s long history usually belongs to a station that no longer exists. Lawton’s airport has only reported since 1996, but the old Lawton co-op station kept records from 1912 to 2004. Moab’s co-op station ran from 1893 until 2024; today the nearby reports come from Arches National Park headquarters. NOAA handles this by threading stations together, which is where “Seattle since 1945” and “Reno since 1893” come from. Where NOAA keeps one of these official threaded records nearby (there are about 270, Lawton and Boise among them), the page uses it. Everywhere else it builds its own the same way: the current station’s record, joined with older stations within six miles of it.
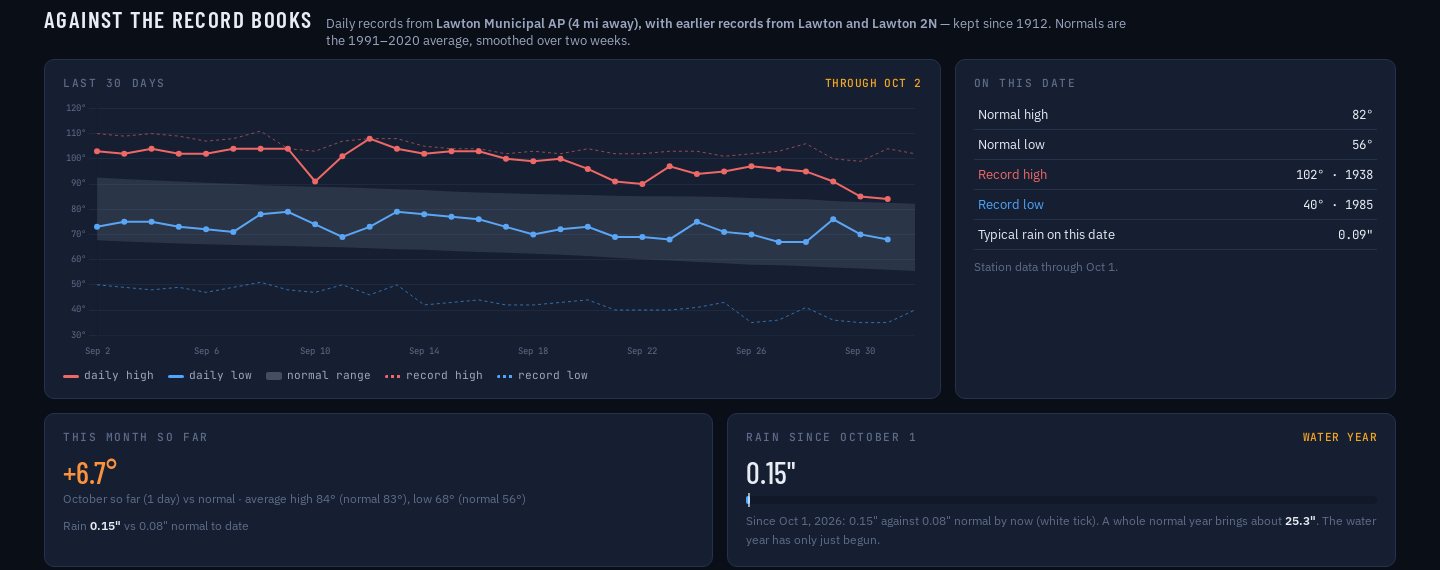
Lawton’s September: highs of 100°+ for two weeks, 108° on the 12th, then the cold front. Records from the airport joined with the old town stations, back to 1912.
Lawton turned out to be a good test. Its September was brutal, with highs of 102–104° for the first week and 108° on the 12th, up against the record line for the date. I checked those numbers against the Iowa archive before believing them; they match to the degree. The first version of this also picked the wrong station: Fort Sill’s airfield, which has a long record but a gap across 1991–2020, so it had no normals and reported Lawton as 87° above normal. Now the page tries up to three stations until it finds one with normals, never shows a departure without one, and flags it when a station has skipped reporting rain (Bend’s skipped 153 days in the last water year).
When’s the first freeze?
It’s October, so the question everyone with a garden is asking has an answer in the record books. From each station’s full daily history the page finds the first night of every fall at or below 32°, and shows the typical date, the range that covers eight winters out of ten, the earliest and latest on record, how many winters have already had one by today, and whether this one has yet. It works for searched places too.
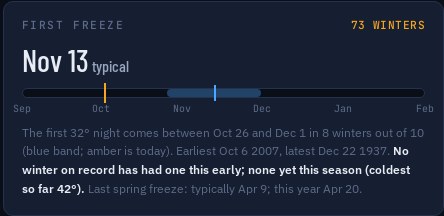
Sonora: the first freeze usually comes in mid-November. The blue band is eight winters in ten; amber is today.
The four stations could hardly be more different. Reno’s typical first freeze is October 4, and more than 40% of winters there have had one by now (the earliest was August 10, 1962). Lakewood’s comes around November 11 and Sonora’s November 13. Death Valley’s is December 9, and in 6% of winters it never freezes at all. The same card shows the last freeze of spring: Reno’s is typically May 19, which is why Reno gardeners wait until late May or June to plant tomatoes.
Radar
Finally, a radar map: the last hour of the National Weather Service’s NEXRAD radars, stitched into one picture every five minutes by the Iowa Environmental Mesonet, looping over a dark map centred on whichever place is selected. It only starts loading when you scroll to it.
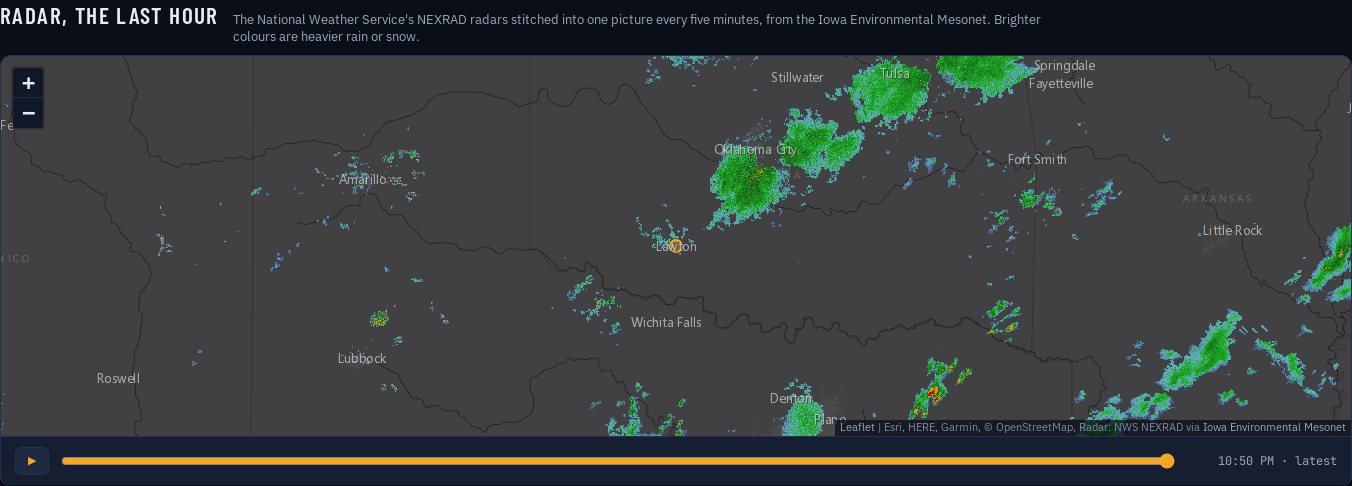
Searching Lawton this afternoon: showers over Oklahoma City and Tulsa behind the cold front, storms in north Texas.
Everything is still free: the National Weather Service API, ACIS, the Iowa Environmental Mesonet and Open-Meteo, none of which need a key. A physical station in my yard would still cost $385–$765, and it would only cover one of the four.
Corrections to the April post: the dashboard updated every 30 minutes on paper, and in practice every three to four hours, not every 15 minutes; its “current conditions” were a model estimate, not measurements; and Death Valley’s station is at −190 ft, not −282 ft.
Go deeper
Your weather forecast update: Warmer climate will be the new ‘normal’ — NPR (via Vermont Public), 7 April 2021, about 4 min. Jennifer Ludden on the switch to the 1991–2020 normals this page compares every day against.
How accurate is the weather forecast? — TED, November 2021, about 2 min video. Mona Chalabi keeps score on the forecast, much as the page now does, and says when to trust it.
Murphy, A.H. (1993). What is a good forecast? An essay on the nature of goodness in weather forecasting. Weather and Forecasting 8(2), 281–293.
Arguez, A., Durre, I., Applequist, S., Vose, R.S., Squires, M.F., Yin, X., Heim, R.R. Jr. & Owen, T.W. (2012). NOAA’s 1981–2010 U.S. Climate Normals: an overview. Bulletin of the American Meteorological Society 93(11), 1687–1697.
Daly, C., Conklin, D.R. & Unsworth, M.H. (2010). Local atmospheric decoupling in complex topography alters climate change impacts. International Journal of Climatology 30(12), 1857–1864.
El Fadli, K.I., Cerveny, R.S., Burt, C.C., Eden, P., Parker, D., Brunet, M. and others (2013). World Meteorological Organization assessment of the purported world record 58°C temperature extreme at El Azizia, Libya (13 September 1922). Bulletin of the American Meteorological Society 94(2), 199–204.
Doubts cloud Death Valley’s 100-year heat record — KPBS, 2013; weather historian Christopher Burt on why a lone 134° with no neighbors to back it up gives him pause.
Mountain Meteorology: Fundamentals and Applications — C. David Whiteman, Oxford University Press, 2000; the classic on cold-air pools, thermal belts and valley nights.
NWS API — the station observations, forecasts, discussions and alerts the page reads live. · Iowa Environmental Mesonet — the backup source and the radar loop.
SC-ACIS — the Regional Climate Centers’ window on every station’s daily history. · NCEI daily climate normals, 1991–2020 — NOAA’s official normals.
Open-Meteo Previous Model Runs API — the archived forecasts that let the scoring start with 200 days of history. · Death Valley weather and climate — NPS.
Weather Station live dashboard — try the search box. · Source on GitHub.