The day after I wrote SIERRA-FLOW in COBOL, I wrote CASCADIA-WX in FORTRAN, the language the atmosphere has been computed in since 1957. It read the snow stations around Rainier, the Olympics and the Cascades every morning, and its big finding was that the Cascade passes were bare in early April and the range was at 15% of normal snowpack. This week I went back to it, the way I went back to SIERRA-FLOW, and that finding didn’t survive the first check.
What it got wrong
Three of the stations didn’t exist. The program asked NRCS for stations 774, 778 and 780 as Snoqualmie, Stevens and Stampede passes. NRCS answered “Stations do not exist” for all three, and the fetcher quietly filled in zero inches of snow and carried on. That’s where the bare passes came from. Stevens Pass is really station 791 and Stampede Pass 788, and there’s no SNOTEL at Snoqualmie Pass itself: Olallie Meadows, just south of it, is the one. NRCS’s own numbers for April 2 show Olallie Meadows holding 24.8 inches of water (46% of median) and Paradise 38.3 inches (53%). A poor winter, not a bare one.
The normals were made up. Each station had one April 1 figure that didn’t match NRCS (Paradise 50.3 inches; NRCS’s April 1 median is 72.6), and every day of the year was compared against it.
The atmospheric river index wasn’t a measurement. It was a formula of snow level and snowpack, and on a dry October 1 it announced “STRONG AR CONDITIONS, PINEAPPLE EXPRESS”. The storm types and stability classes were invented the same way.
So I rebuilt it on NRCS’s real stations and NRCS’s own 1991–2020 medians. Then, on the day I sat down to finish it, NRCS’s data service went down: an error for every station, all day. And in the first week of October there’s no snow on the stations anyway. I needed something to read that’s there every day of the year.
Up instead of out
Twice a day, at weather offices all over the world, someone lets go of a balloon. It carries a radiosonde, a little instrument box that radios back the temperature, humidity and wind every few seconds as it climbs about 20 miles into the sky. Four go up in the Pacific Northwest: Quillayute on the Washington coast, where the Pacific storms arrive, Salem in the Willamette Valley, Medford in southern Oregon and Spokane east of the mountains. The Iowa Environmental Mesonet keeps all of them, decades deep, free.
CASCADIA-WX now reads every level of every flight. From each one, FORTRAN works out the freezing level, the wet-bulb zero, an estimated snow level (1,000 feet below the freezing level, the Weather Service’s rule of thumb), the precipitable water and the integrated vapour transport: how much water vapour the whole column is carrying sideways. At 250 kilograms per metre per second that’s an atmospheric river, and the scale goes up through weak, moderate, strong and extreme. I checked FORTRAN against two other tools: for Quillayute on October 2 its precipitable water is 27.6 mm, MetPy gets 27.8 and the University of Wyoming’s sounding page 28.1.
Normal, built in FORTRAN
A number like “freezing level 13,961 feet” means more next to what’s normal for the date, so there’s a second program, NORMALS.f90. It reads every 00Z and 12Z balloon from all four sites from 1991 through 2020, 85,412 of them, and runs each one through the same physics as the daily program, from a shared module. For every site and day of the year it pools the balloons within a week of the date across all 30 years, up to 900 of them, and keeps the 10th, 25th, 50th, 75th and 90th percentiles. Downloading 30 years of balloons takes GitHub about six minutes. FORTRAN takes 42 seconds.
The climatology is fun on its own. Over Quillayute the median freezing level is about 4,300 feet in mid-January and 13,000 in early August. On New Year’s Day in Spokane, at least a quarter of the balloons find it freezing right at the ground. And a balloon is classed the same way SIERRA-FLOW classes a river: below the 10th percentile for the date is much below normal, the 25th to 75th is normal, above the 90th is much above.
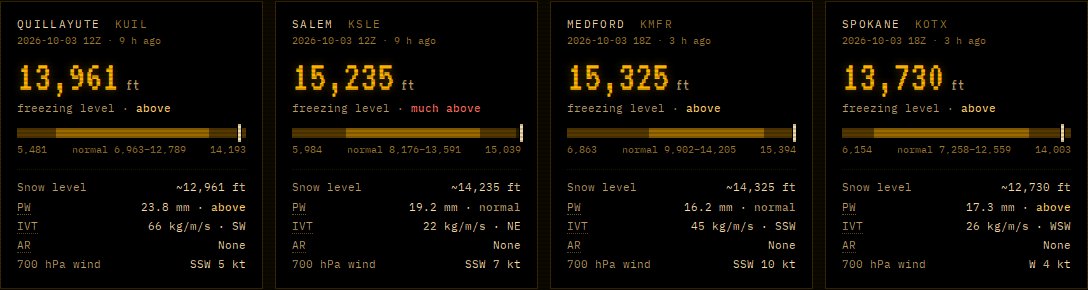
Today's balloons. Each bar runs from the 10th to the 90th percentile for the date; the darker middle is normal, and the white tick is today.
What the air says this week
It’s warm up there. Every site’s freezing level is above normal for October 3. Salem’s balloon this morning found it above freezing to 15,235 feet, higher than nine in ten balloons from that week of the year since 1991. Quillayute’s 13,961 feet is above its normal range of 6,963 to 12,789.
A week ago it was cold. On the morning of September 26, Quillayute’s freezing level was down at 5,512 feet, well below normal. Fall in the Northwest swings like that.
The first atmospheric rivers of the season. On September 29 the Quillayute balloon measured 705 kg/m/s of vapour transport, a moderate atmospheric river. Two more balloons on October 1 and 2 reached weak AR strength, the first of water year 2027, which began on October 1. For scale, last water year Quillayute had 113 of its 689 balloons at AR strength, about one in six, and the strongest, 845 kg/m/s, came in December.
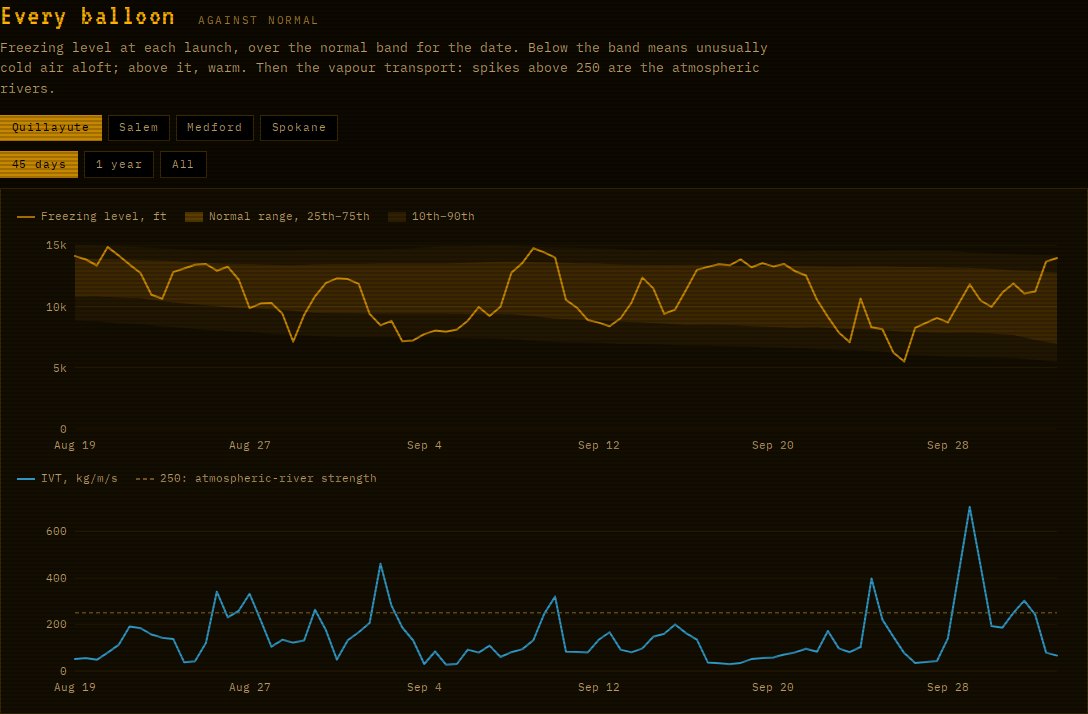
Forty-five days at Quillayute. Top: the freezing level against the normal band for each date. Bottom: vapour transport, with atmospheric-river strength dashed at 250.
Surprises in the data
Not every balloon goes up when I thought. The classic launch times are 00Z and 12Z, 5 a.m. and 5 p.m. here. The archive says Spokane has been launching at 06Z and 18Z for at least a year, and Medford switched to 00Z and 18Z in July. I didn’t believe it until the University of Wyoming’s archive showed the same thing. The normals come from 00Z and 12Z flights, so for those launches the comparison is rougher near the ground, where the time of day matters most, and the page says so.
The archive has gaps. The Iowa archive is missing Salem’s balloons from September 29 to October 2, which Wyoming has. So every run now looks back ten days and picks up anything that arrived late.
And I had a bug. The report’s table of recent balloons was quietly dropping every 12Z flight, because it lined the sites up by their own latest balloons and Medford and Spokane are on a different clock now. Fixed, and the printout below is from after the fix.
The page
The live page is an amber terminal. It plays back the real job log from the latest run, shows each site’s balloon level by level, and draws every balloon’s freezing level over its normal band. Amber is the temperature, green the wet-bulb and blue the dew point; where blue strays far from amber the air is dry, and the freezing level is where amber crosses zero.
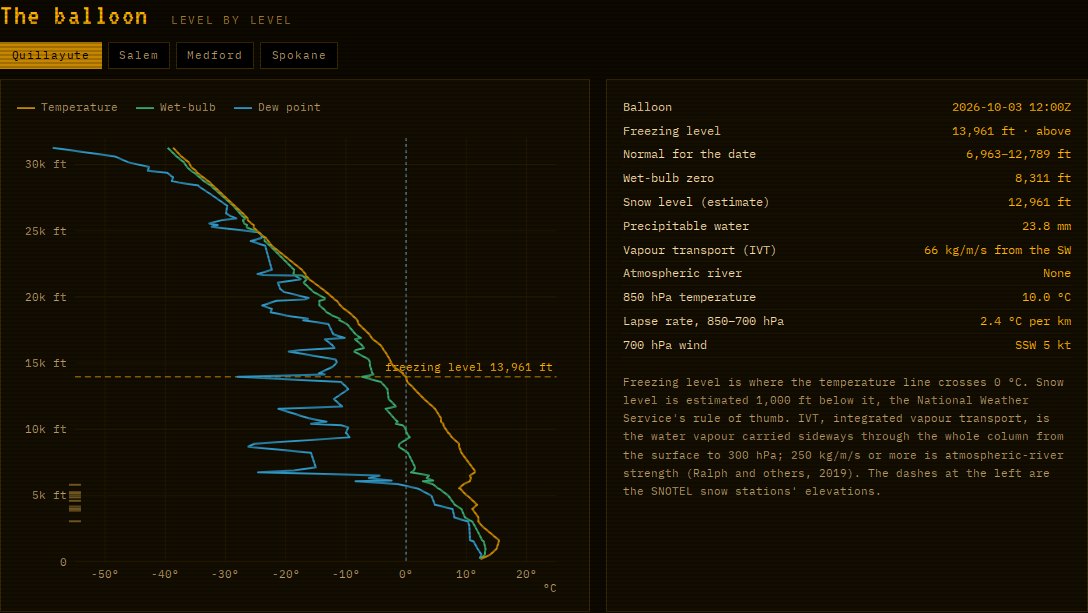
This morning's Quillayute balloon, level by level.
The report comes off a line printer, 132 columns on green-bar paper, exactly as FORTRAN wrote it. And the loop that adds up the water vapour is copied live from the source onto a 1957 IBM FORTRAN coding form, the paper programmers wrote on before a keypunch operator turned it into cards. It’s modern free-form FORTRAN, so it doesn’t need the form’s columns, but every line of the program keeps to its 72-column width anyway.
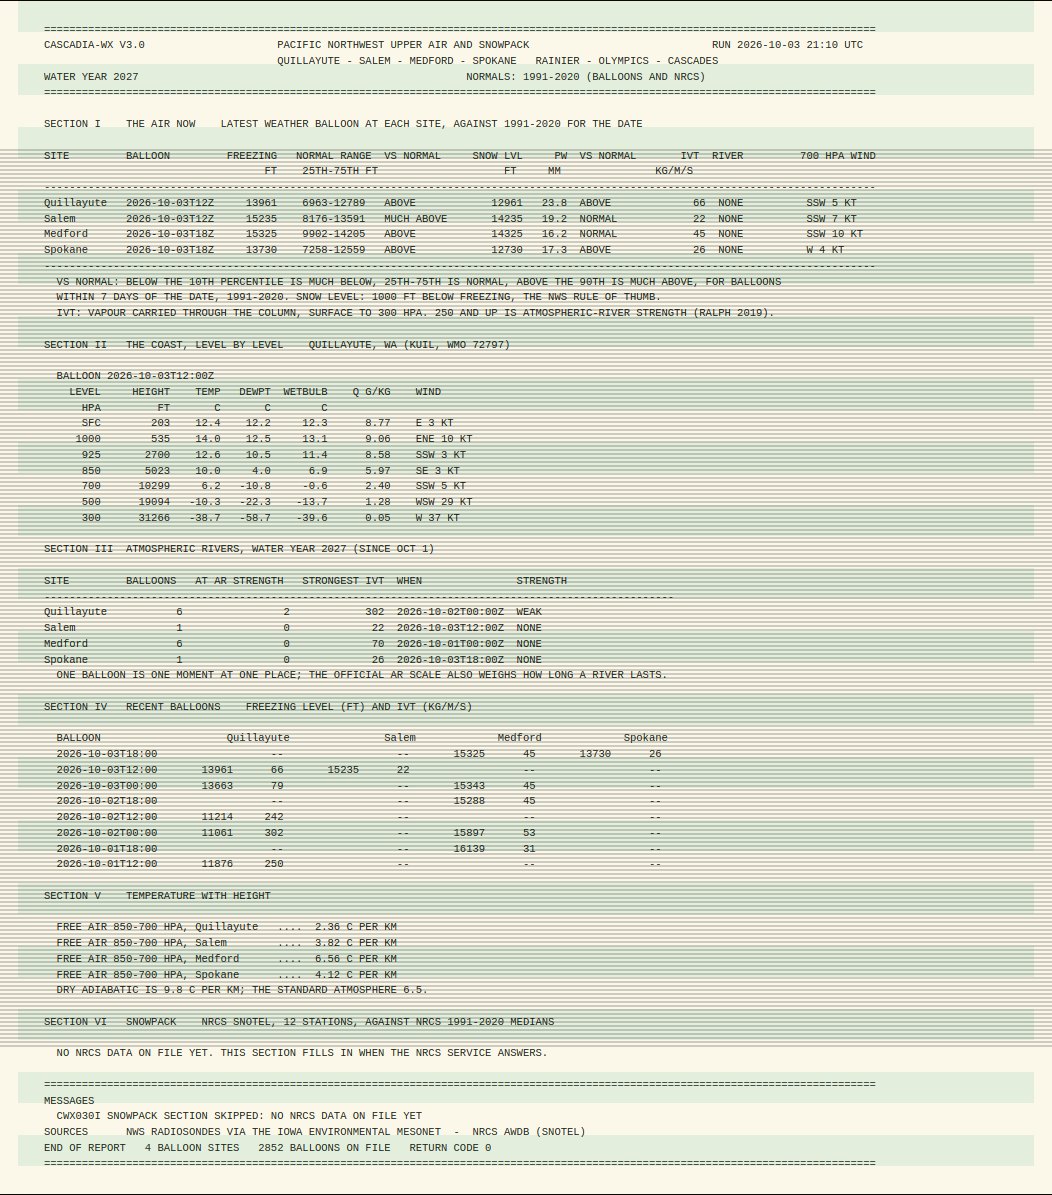
Tonight's printout, 132 columns, exactly as the program wrote it.
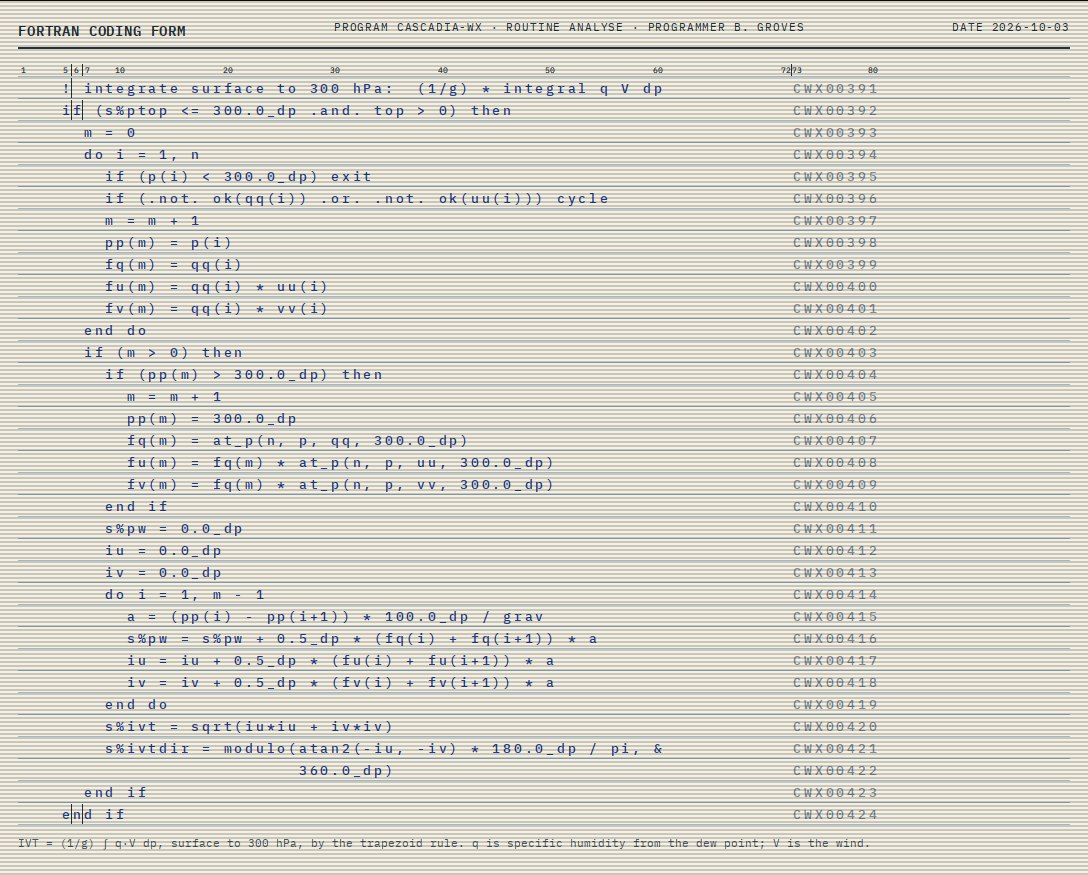
The vapour-transport loop on a FORTRAN coding form, copied from the source every time the page loads.
How it runs
At 8:17 every morning and evening, after each round of balloons reaches the archive, a GitHub Action on Ubuntu runs the batch job: a stdlib-only Python script fetches the new balloons, GFortran 13 compiles the program, and FORTRAN runs and sets a return code, 0 for normal and 4 when something is late or missing. The outputs are committed and the page reads them; it draws charts but doesn’t calculate anything. The snow stations are still in there, with NRCS’s real medians, and the snowpack section fills itself in on the first run after NRCS answers. All free, no keys.
FORTRAN was built so scientists could write formulas that look like formulas. Version 3 finally measures the atmosphere instead of guessing at it, and it does it twice a day, snow or no snow.
Corrections to the April post: the bare passes and the 15% figure came from three station IDs that don’t exist; the percent-of-normal figures there, including Paradise at 73%, were against made-up April 1 normals; and the atmospheric river index and storm classification were formulas, not measurements. Code: github.com/bdgroves/cascadia-wx.
Go deeper
Ep 45: Atmospheric Rivers — Water Talk, 17 March 2023 (first aired June 2020), about 41 min. Daniel Swain and Katerina Gonzales on rivers in the sky, the water they bring and the floods they cause.
Weather balloon launch suspensions could lead to less accurate forecasts from Medford — Jefferson Public Radio, 18 April 2025, under a minute. Roman Battaglia on the staffing cuts behind Medford’s changed launch times, the surprise in this post’s data.
Zhu, Y. & Newell, R.E. (1998). A proposed algorithm for moisture fluxes from atmospheric rivers. Monthly Weather Review 126(3), 725–735.
Neiman, P.J., Ralph, F.M., Wick, G.A., Lundquist, J.D. & Dettinger, M.D. (2008). Meteorological characteristics and overland precipitation impacts of atmospheric rivers affecting the West Coast of North America based on eight years of SSM/I satellite observations. Journal of Hydrometeorology 9(1), 22–47.
Ralph, F.M., Rutz, J.J., Cordeira, J.M., Dettinger, M., Anderson, M., Reynolds, D., Schick, L.J. & Smallcomb, C. (2019). A scale to characterize the strength and impacts of atmospheric rivers. Bulletin of the American Meteorological Society 100(2), 269–289.
Durre, I., Vose, R.S. & Wuertz, D.B. (2006). Overview of the Integrated Global Radiosonde Archive. Journal of Climate 19, 53–68.
May, R.M., Goebbert, K.H., Thielen, J.E., Leeman, J.R., Camron, M.D., Bruick, Z., Bruning, E.C., Manser, R.P., Arms, S.C. & Marsh, P.T. (2022). MetPy: A meteorological Python library for data analysis and visualization. Bulletin of the American Meteorological Society 103(10), E2273–E2284.
Atmospheric Rivers — Ralph, Dettinger, Rutz & Waliser (eds.), Springer, 2020; the field’s textbook, from vapour transport to the AR scale.
Iowa Environmental Mesonet RAOB archive — the balloons CASCADIA-WX reads, decades deep. · University of Wyoming soundings — the cross-check for gaps and launch times.
NOAA IGRA — the global radiosonde archive, back to 1905. · NWS Upper-air Observations Program — the people who let go of the balloons.
CW3E atmospheric river forecasts — Scripps’s IVT and AR-scale forecasts for the West Coast. · NRCS Washington Snow Survey — the snow stations, with real medians.
CASCADIA-WX live page — the amber terminal. · Source on GitHub — FORTRAN, normals and all.