I grew up in Groveland, about two miles up the road from Big Oak Flat, in a county where the hills are full of holes. Old shafts behind fences, tunnels into hillsides, heaps of pale rock in the oak woods. Nobody had to tell you this was gold country. So I finally went and counted the holes, and then took the trees away to look at the ground.
Mother Lode is the result: a map of Tuolumne County’s gold country in bare-earth lidar, with every mine the USGS ever drew on its old topo maps laid on top.
What the Mother Lode is
The Mother Lode is a line of hard-rock gold deposits about 190 km long and a few kilometres wide, running along the western foothills of the Sierra Nevada. It follows the Melones Fault Zone, along the old seam where a volcanic island arc was jammed onto North America in the Jurassic. Later, gold-bearing quartz veins formed along that seam, some of them 15 m thick.
Miners came at the gold three ways, roughly in order: panning and sluicing the stream gravels from 1848, washing whole hillsides down with water cannons from the 1850s, and following the quartz veins underground from the 1860s. All three left their mark on the ground, and lidar can see all of it.
Counting the holes
For decades, USGS surveyors marked the mine features they saw on their topographic maps: a small symbol for each shaft, tunnel entrance and prospect pit, and an outline around each tailings pile. The USGS has since digitised all of them, map by map. For Tuolumne County alone that comes to 410 adits, 285 shafts and 345 prospect pits, plus 210 outlines of tailings, dumps and pits. The USGS mineral database adds the named mines, and 1,060 of its entries in the county list gold.
Then the lidar. The USGS has flown these foothills with airborne lasers twice, in 2011 and again in 2021–22, and the whole archive sits on Amazon’s cloud in a form you can read a window at a time. Keep only the laser returns that reached the ground, and the trees and buildings are gone. I stitched the two surveys together where one stops and the other carries on; where they overlap they agree to within a few centimetres.
Big Oak Flat: where I start
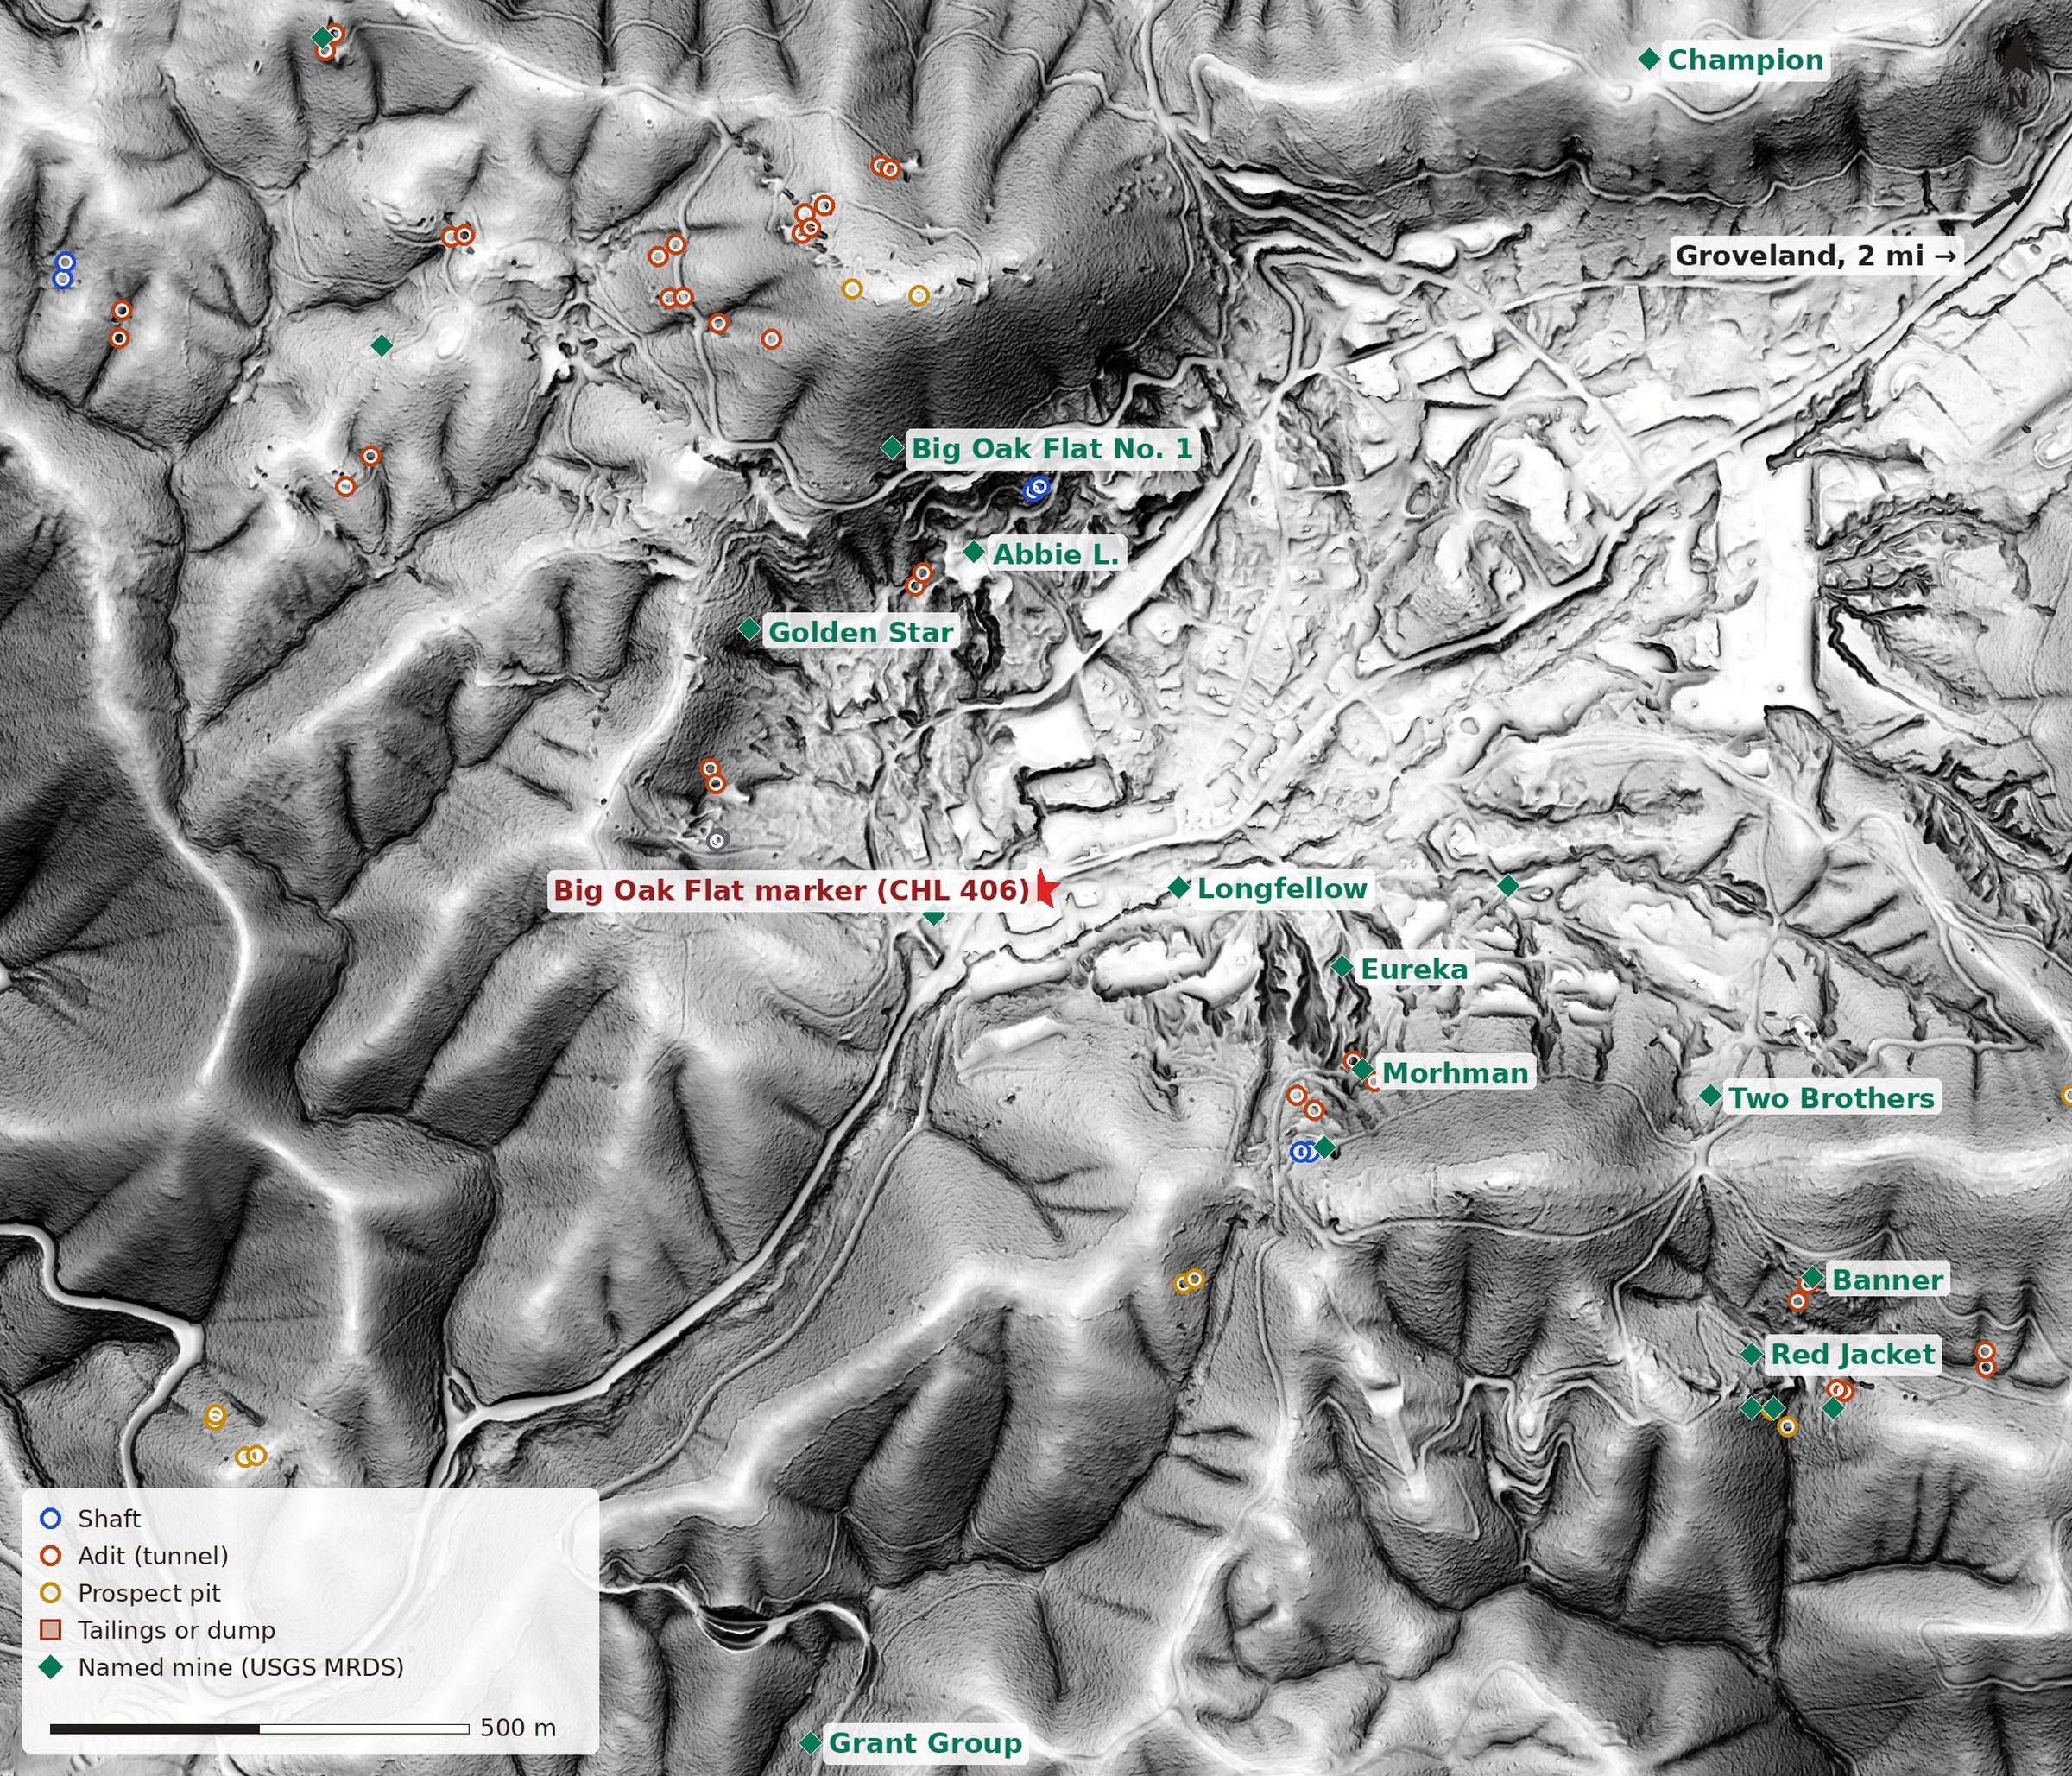
Big Oak Flat in bare-earth lidar, with every mine on the old maps. Click for the full-size map.
Big Oak Flat, just down the road from where I grew up, was first called Savage Diggins after James Savage found gold there in 1848. It was renamed for a giant oak, about 13 feet across, that stood in the middle of town; the tree was undermined in 1869 and burned in 1890, and the historical marker (the red star) stands near the spot. The gravels at Big Oak Flat and Deer Flat are credited with about $25 million in placer gold, and lode mining carried on until World War I.
Here’s how to read the map. Red rings are adits, the tunnels driven into hillsides; blue rings are shafts; gold rings are prospect pits, the holes someone dug and gave up on. Brown outlines are tailings and dumps, and green diamonds are the named mines in the USGS database. Big Oak Flat is ringed with them: the Golden Star, the Abbie L. and Big Oak Flat No. 1 to the north and northwest, the Longfellow and the Eureka right by town, and the Banner and the Red Jacket off to the east-southeast. Groveland, where I grew up, is two miles up the road past the arrow.
Columbia: the rock gardens
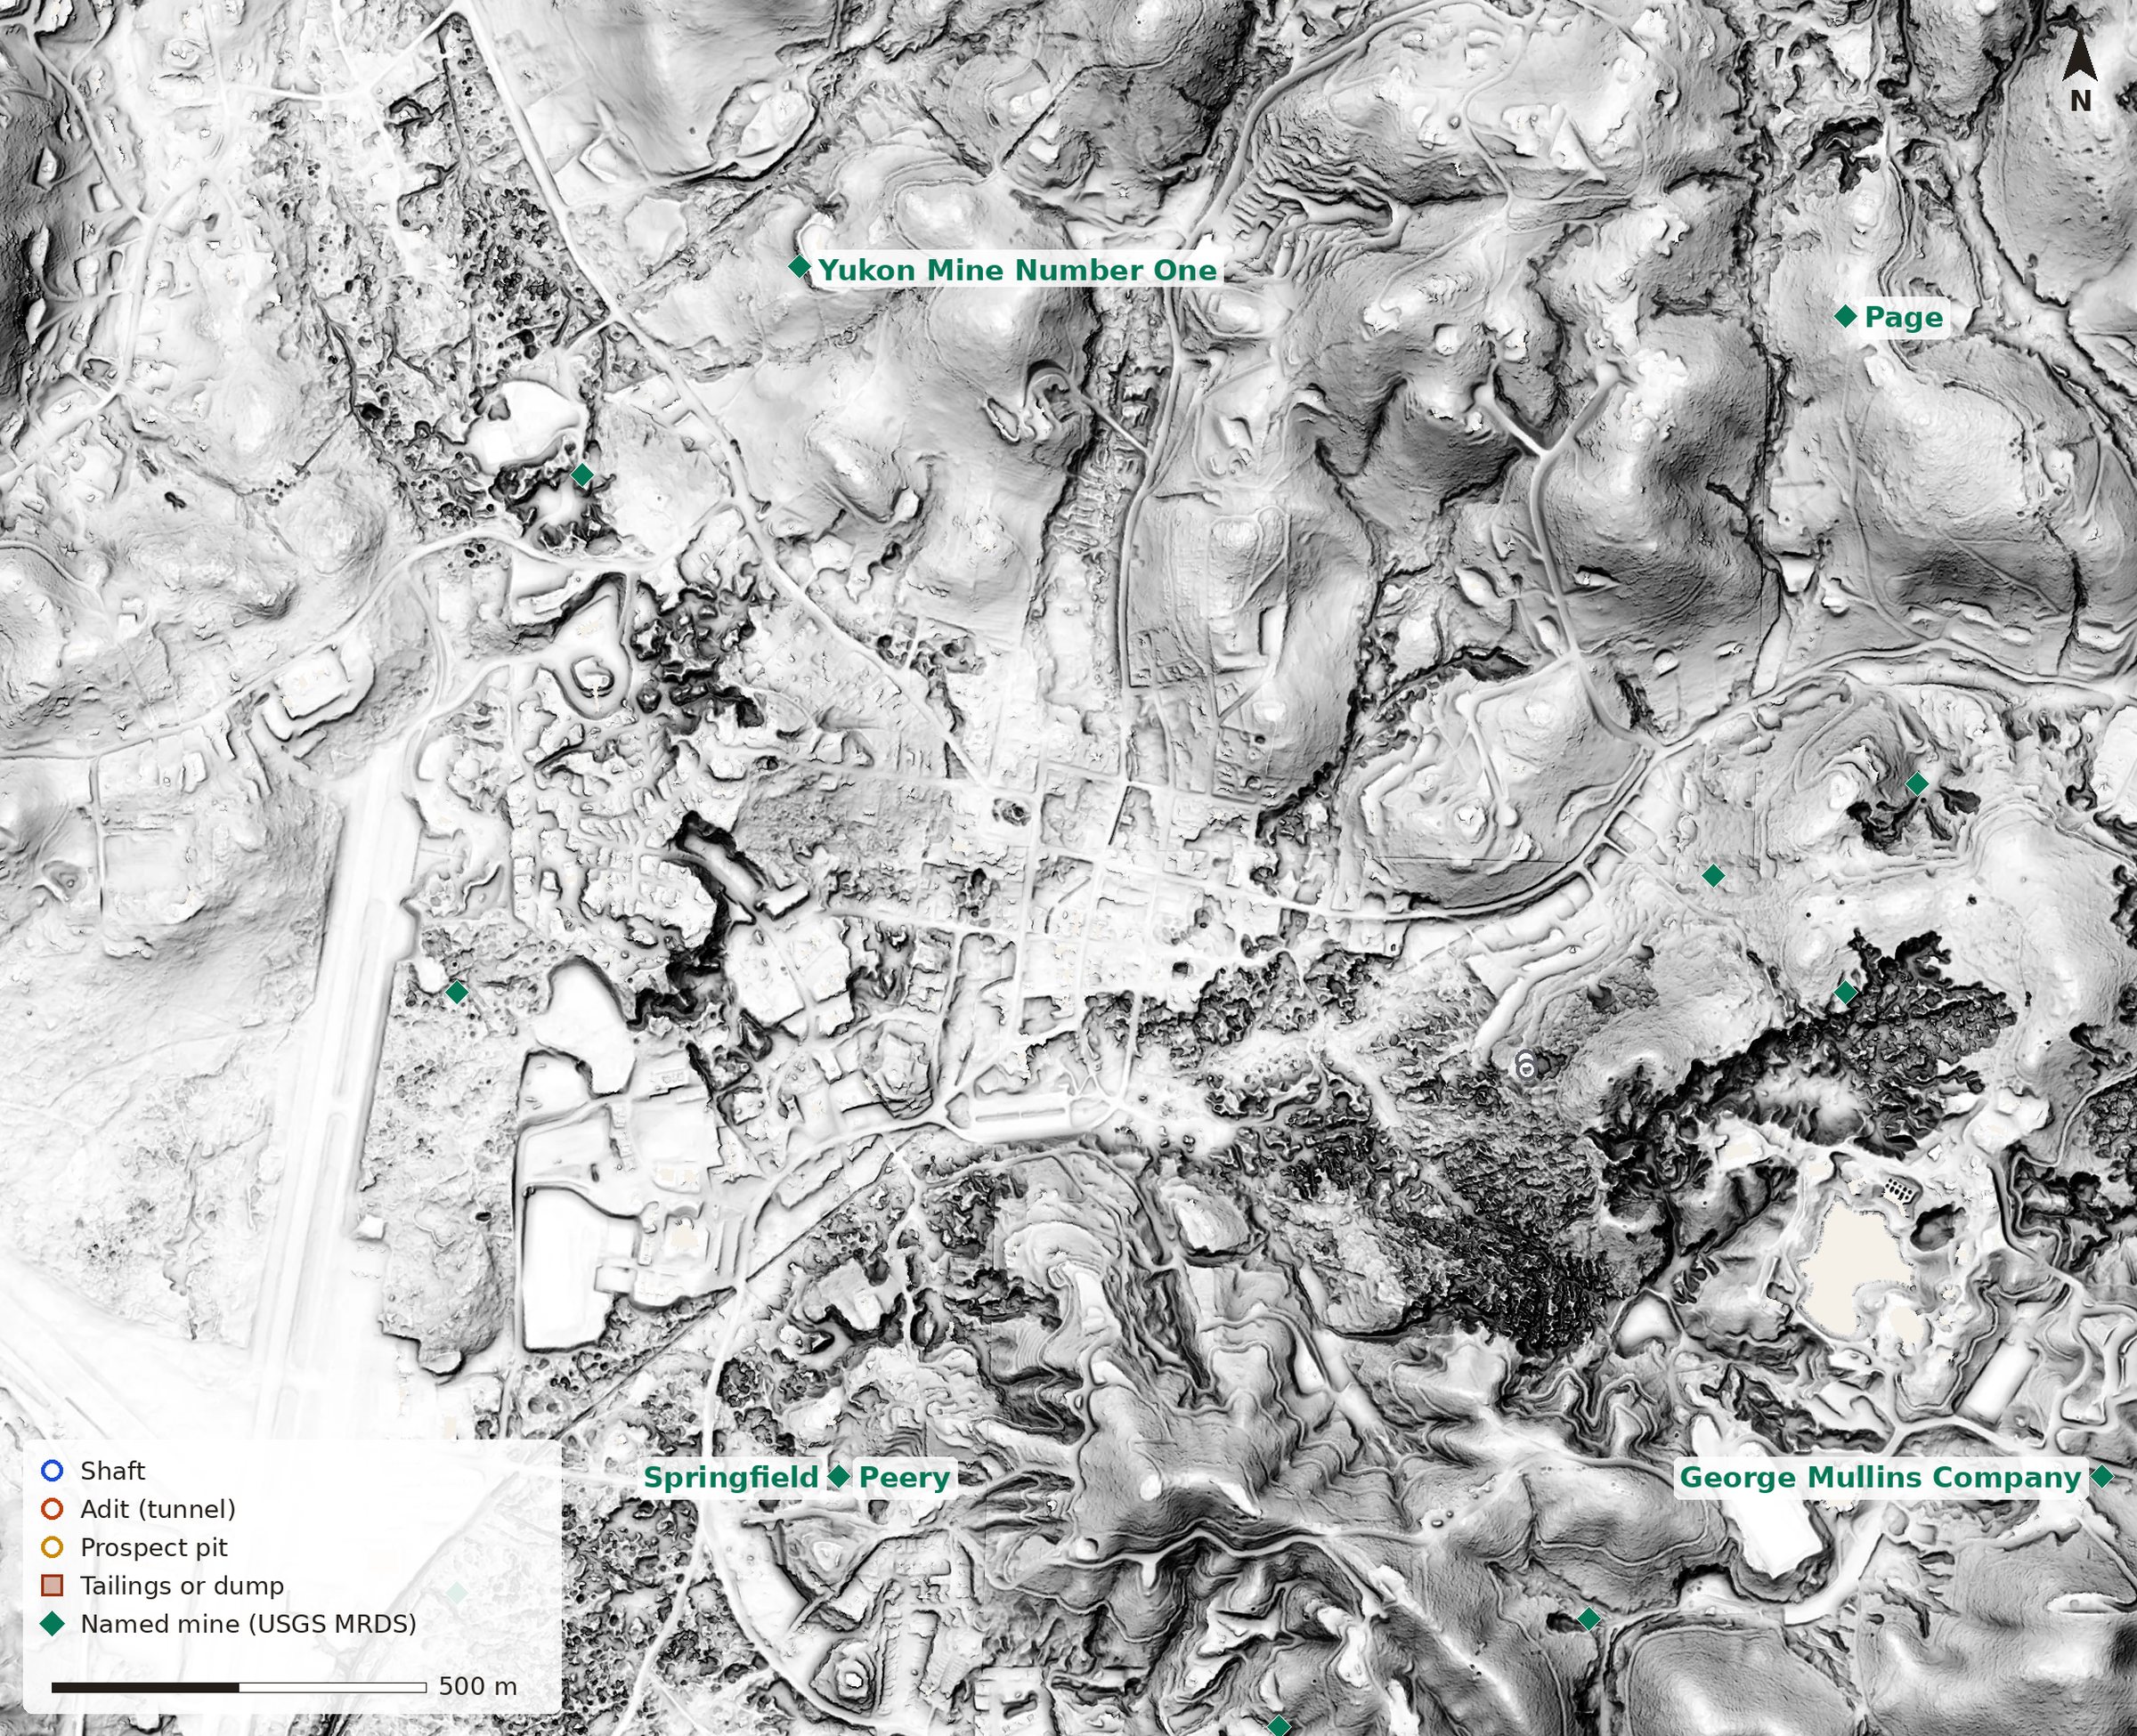
Columbia. The rough, dark ground south and east of the old town is the limestone the miners washed bare. Click for full size.
Gold was found at Columbia on March 27, 1850, and at least $87 million in gold came out of the surrounding hills by the early 1900s. The bedrock here is limestone, which dissolves into knobs, pinnacles and deep potholes, and the potholes were full of rich gravel. Miners dug it out of the crevices and washed the rest away with water, and the pinnacles were left standing. In the lidar it’s that rough, dark band running out of town, and you can walk among the rocks today at Columbia State Historic Park.
The Harvard pit: the modern version
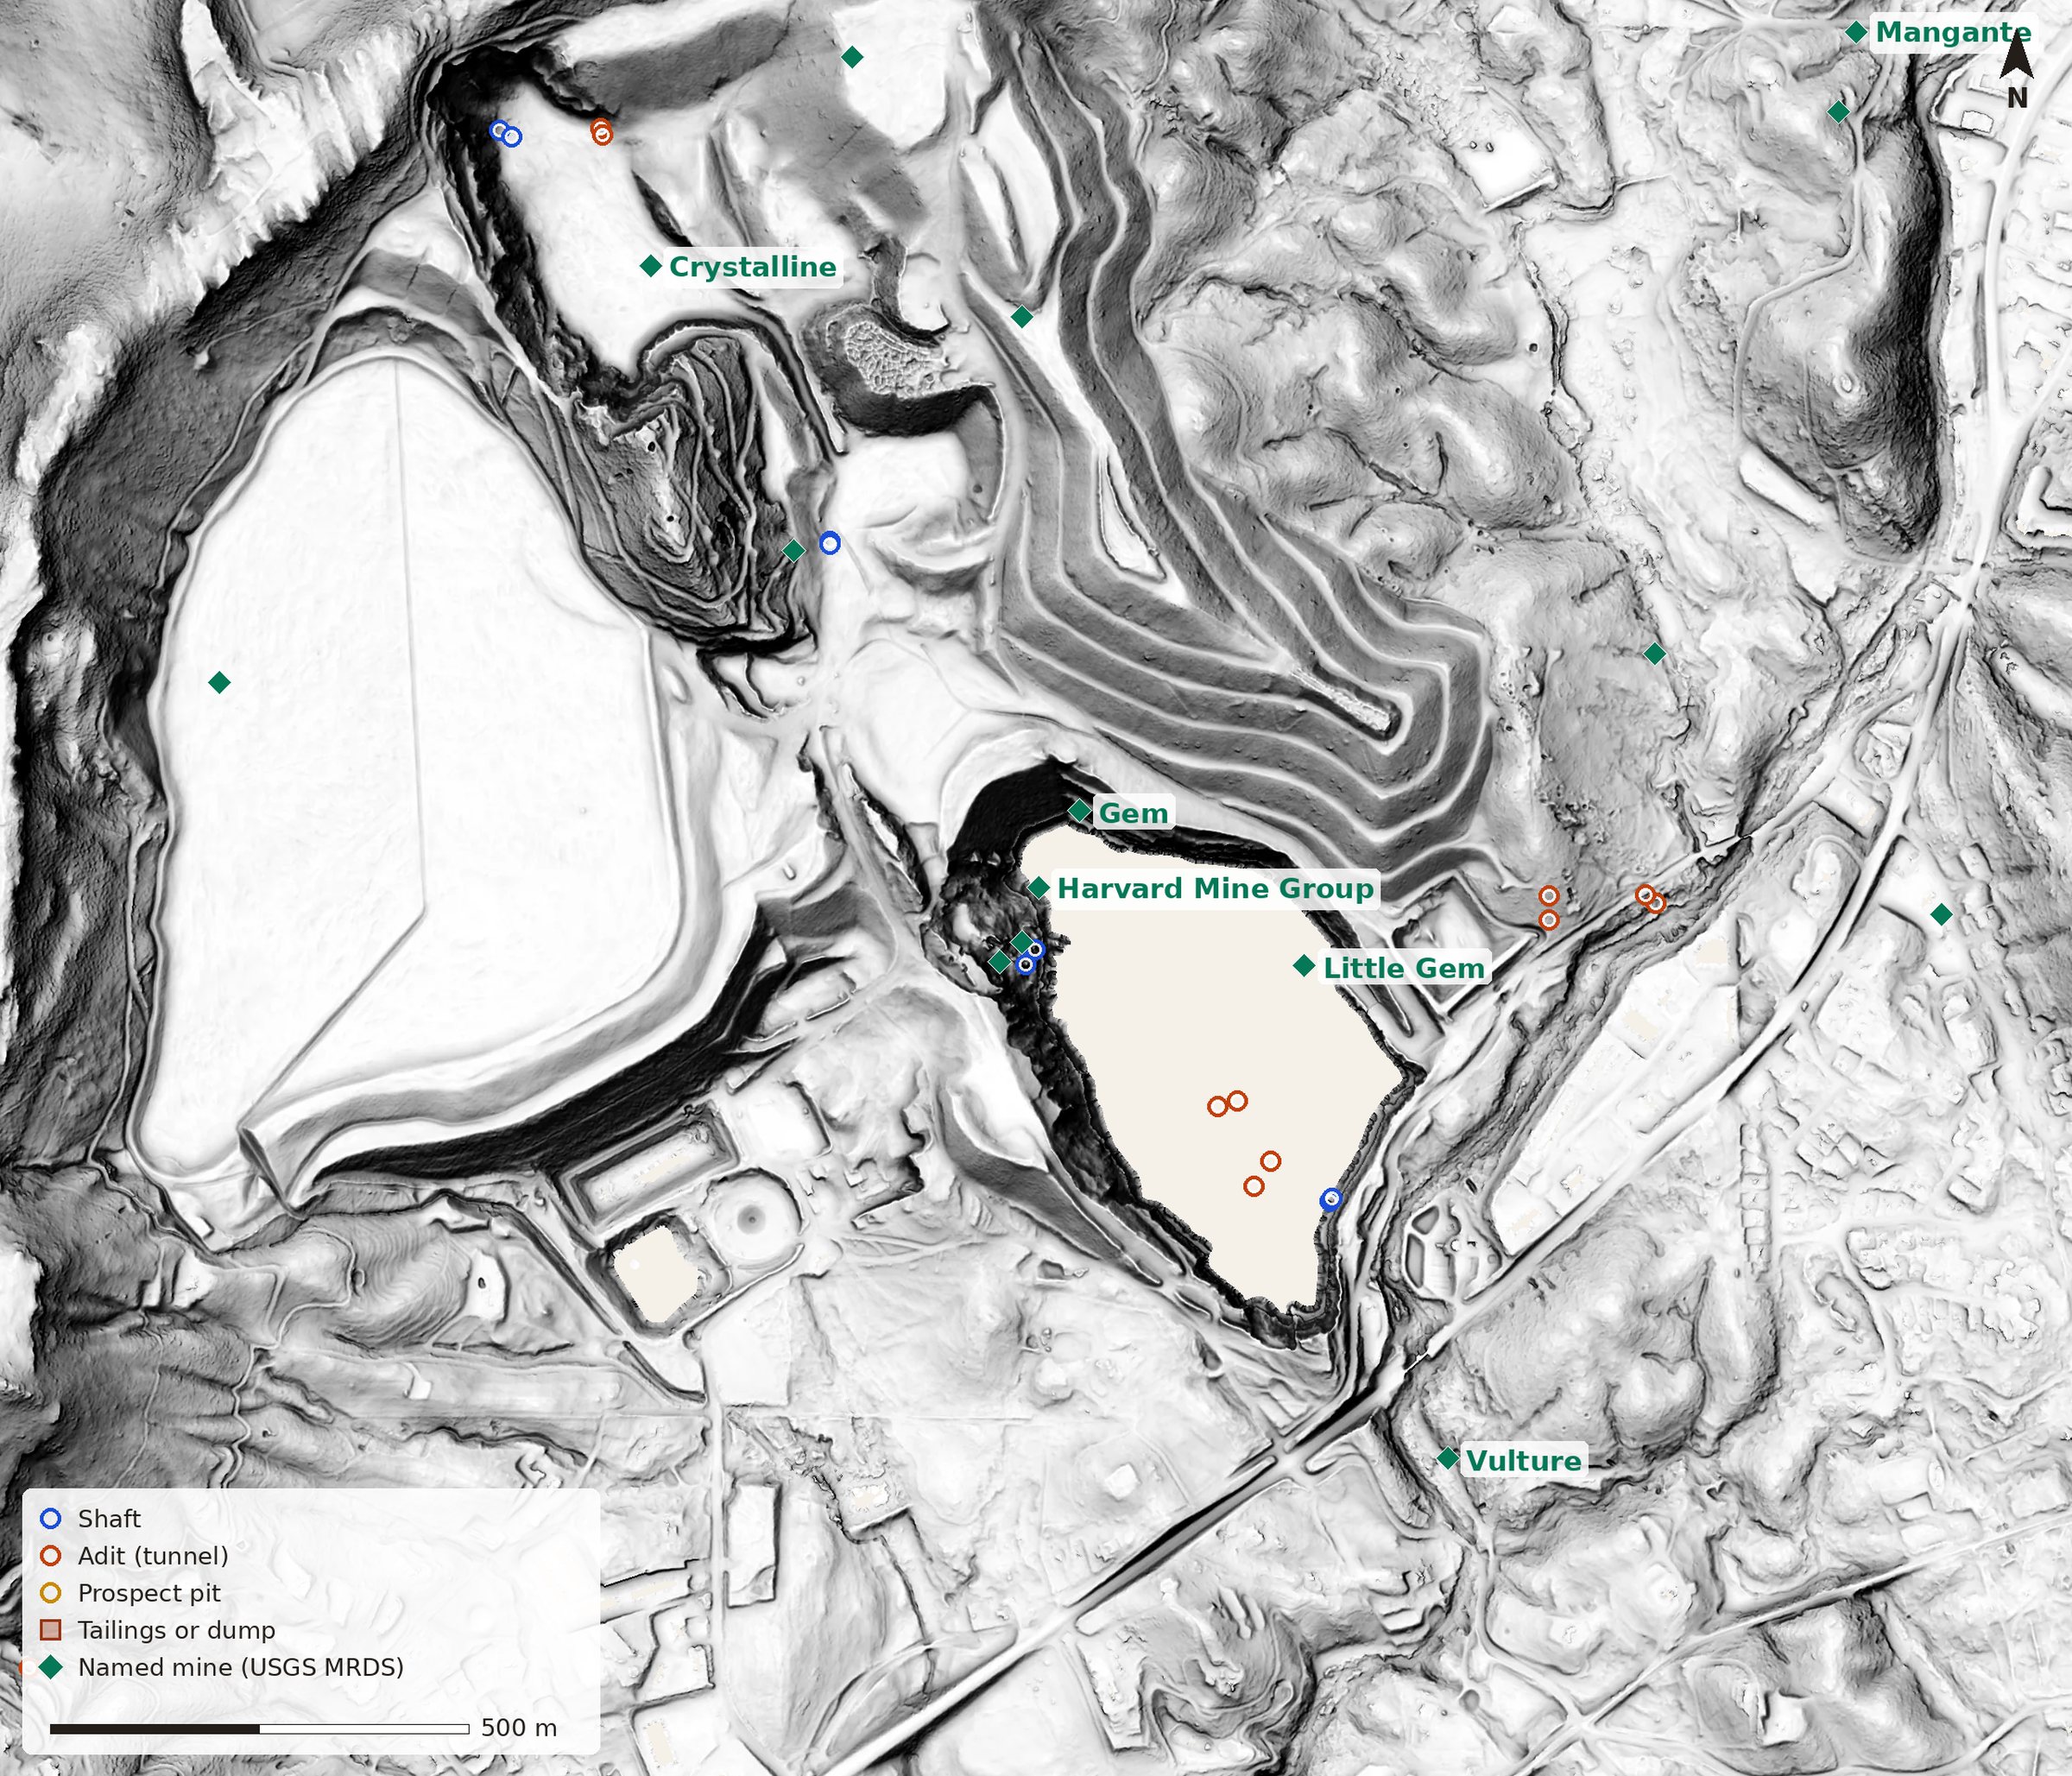
The Harvard pit at Jamestown. The blank shape is the pit lake (lidar doesn’t come back from water); the stepped dumps sit north of it and the capped tailings facility is the flat oval on the left. Click for full size.
Not all the mining is old. From 1986 to 1994, Sonora Mining Corporation dug an open pit at Jamestown about 830 m long, 460 m wide and 185 m deep, taking out the gold-bearing rock along the Melones fault from the top. When mining ended the pit began to fill, and by November 2000 the lake was about 90 m deep. The USGS measured 720 to 1,100 parts per billion of arsenic in its water in 1998 and 1999, and today eleven evaporators sit in the pit to keep the level down. The tailings pond leaked, so it was drained, graded, capped with clay and seeded.
In the lidar it reads like a diagram of a modern mine: the pit, the stepped waste-rock dumps with their haul roads, and the big flat tailings facility, all about a mile from the old Rawhide shafts.
Eagle-Shawmut: tailings under the lake
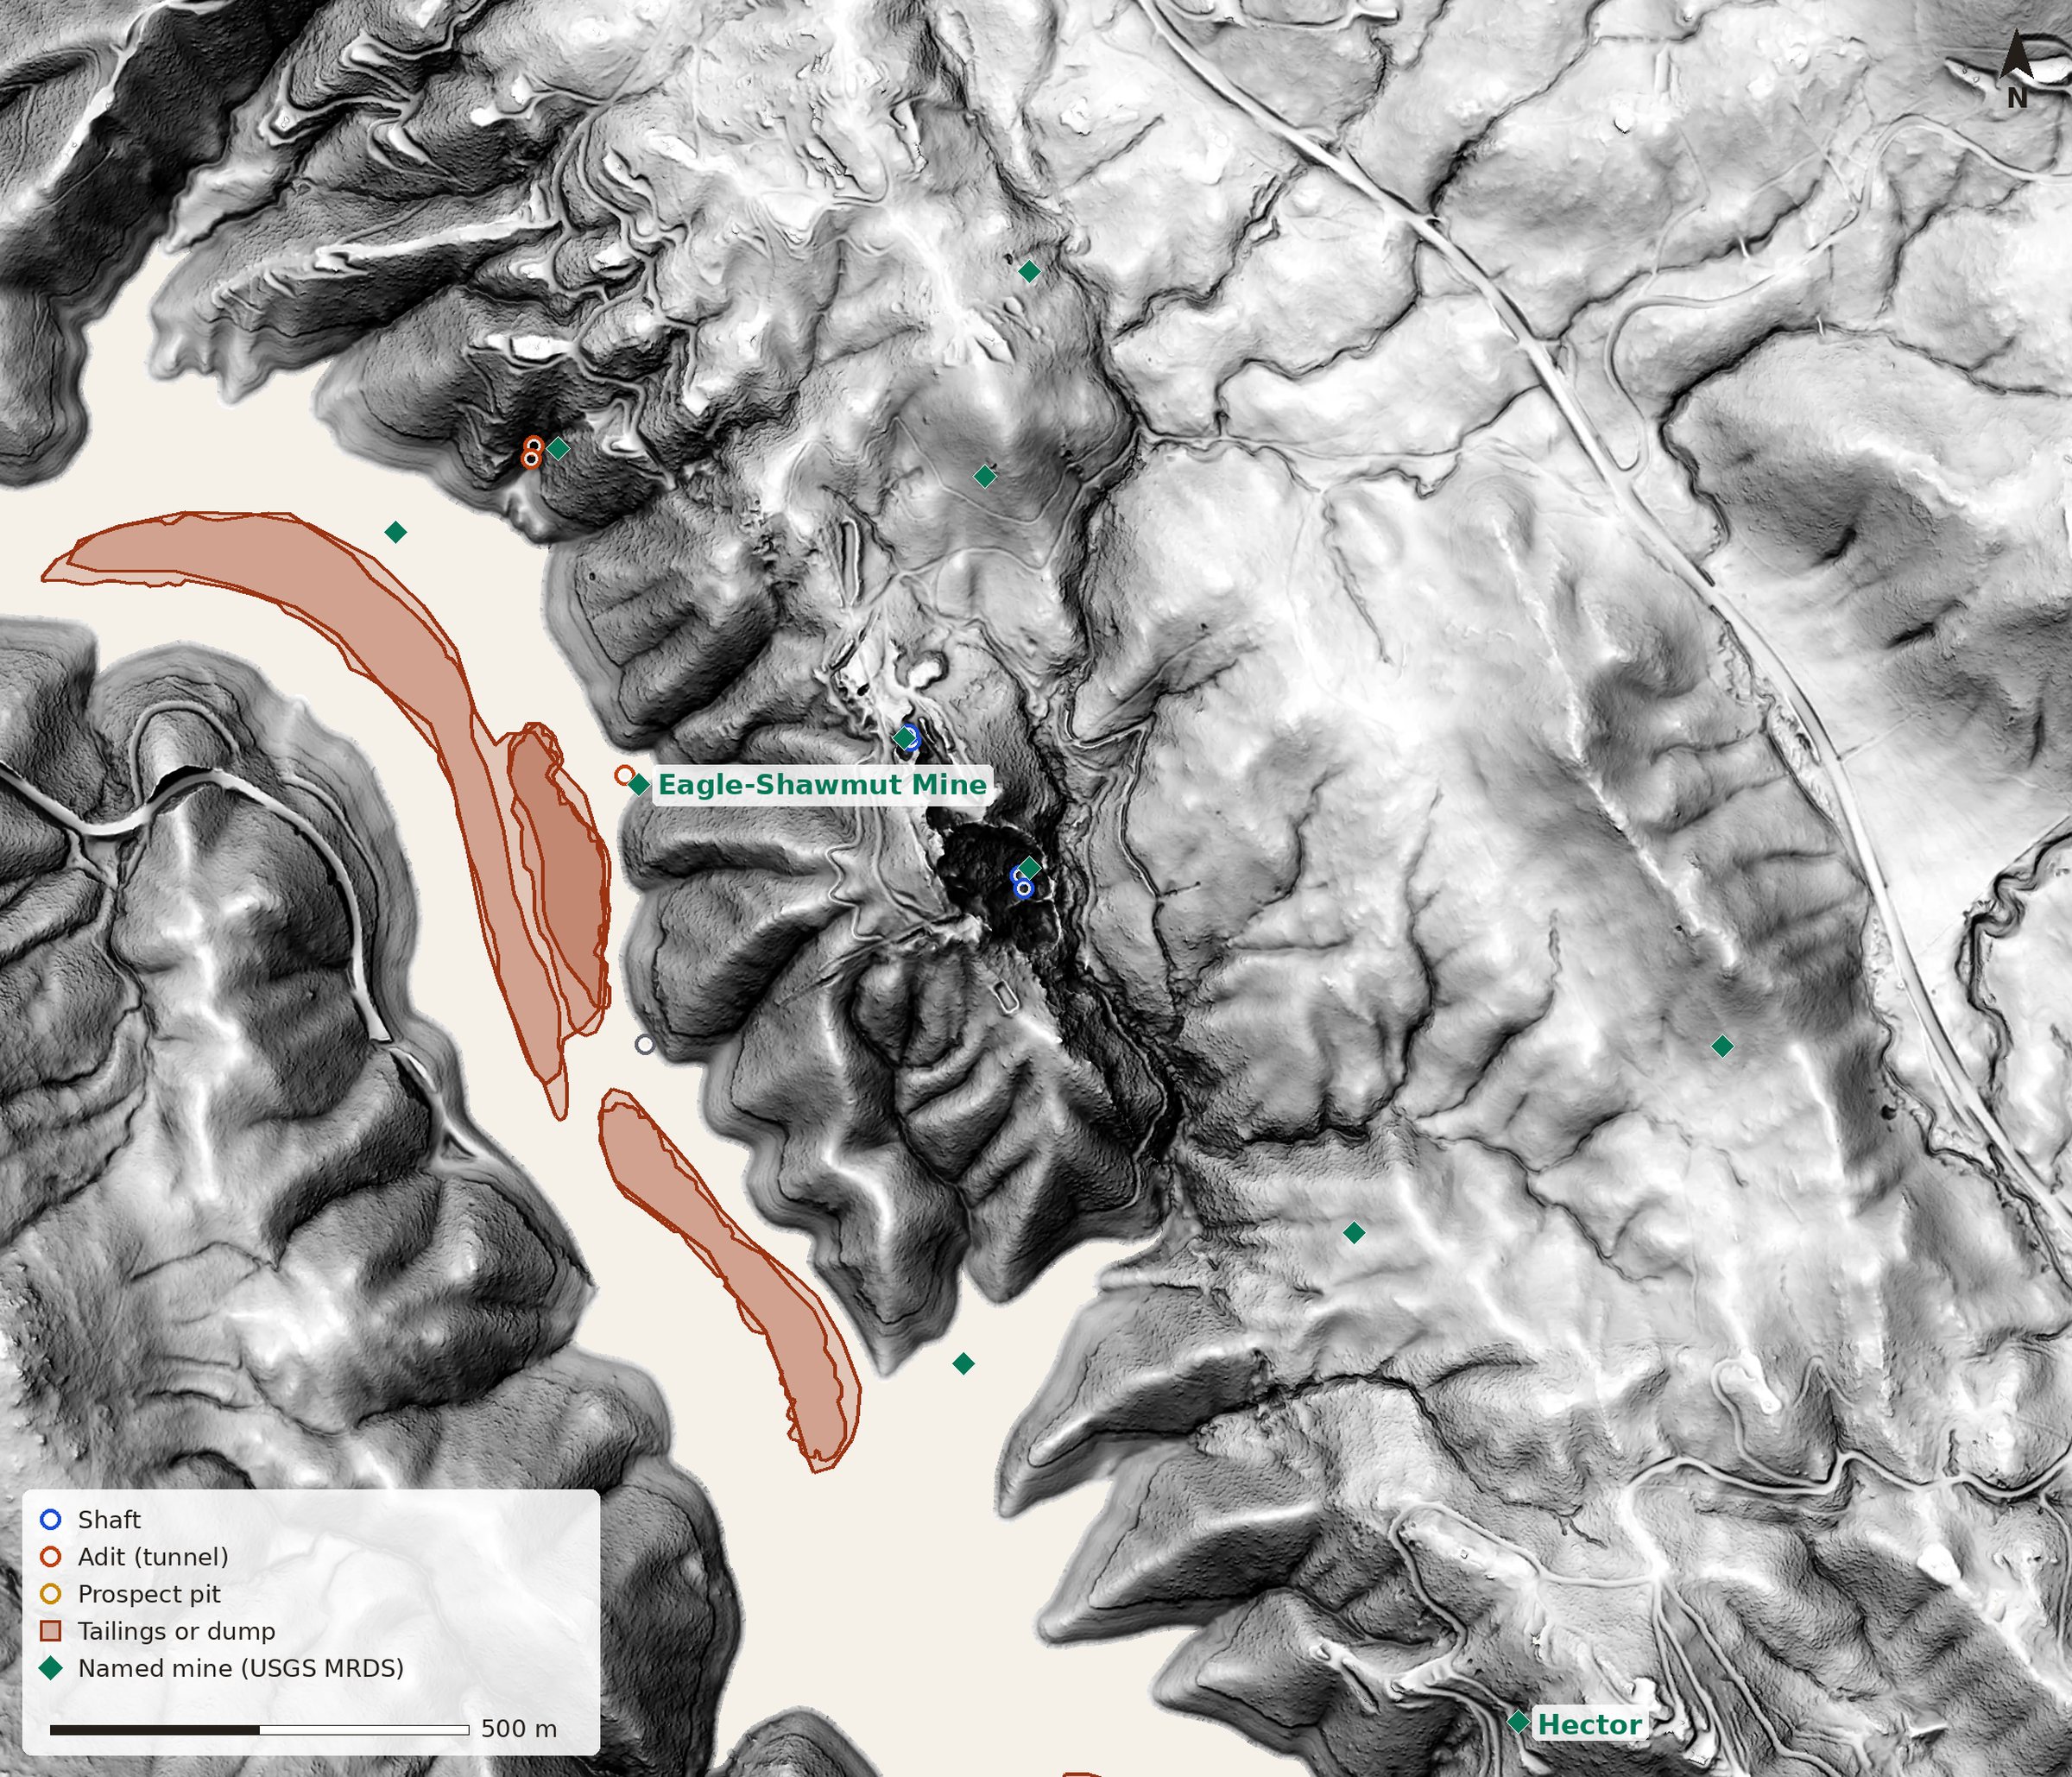
Eagle-Shawmut, east of Chinese Camp. The brown outlines are tailings drawn on USGS topo maps from 1947 to 1973. Today they sit out on Don Pedro Reservoir. Click for full size.
This was the one that surprised me. The Eagle-Shawmut produced about $7.4 million in gold from large bodies of low-grade rock streaked green with mariposite, and by 1940 its workings ran about 2,400 feet down. Its mill stood almost at the level of Woods Creek. Then Don Pedro Reservoir filled the canyon. When I laid the old topo-map outlines over the lidar, the tailings the surveyors drew in 1947 and 1948 landed out on the water. The lake has most likely swallowed them.
The Rawhide
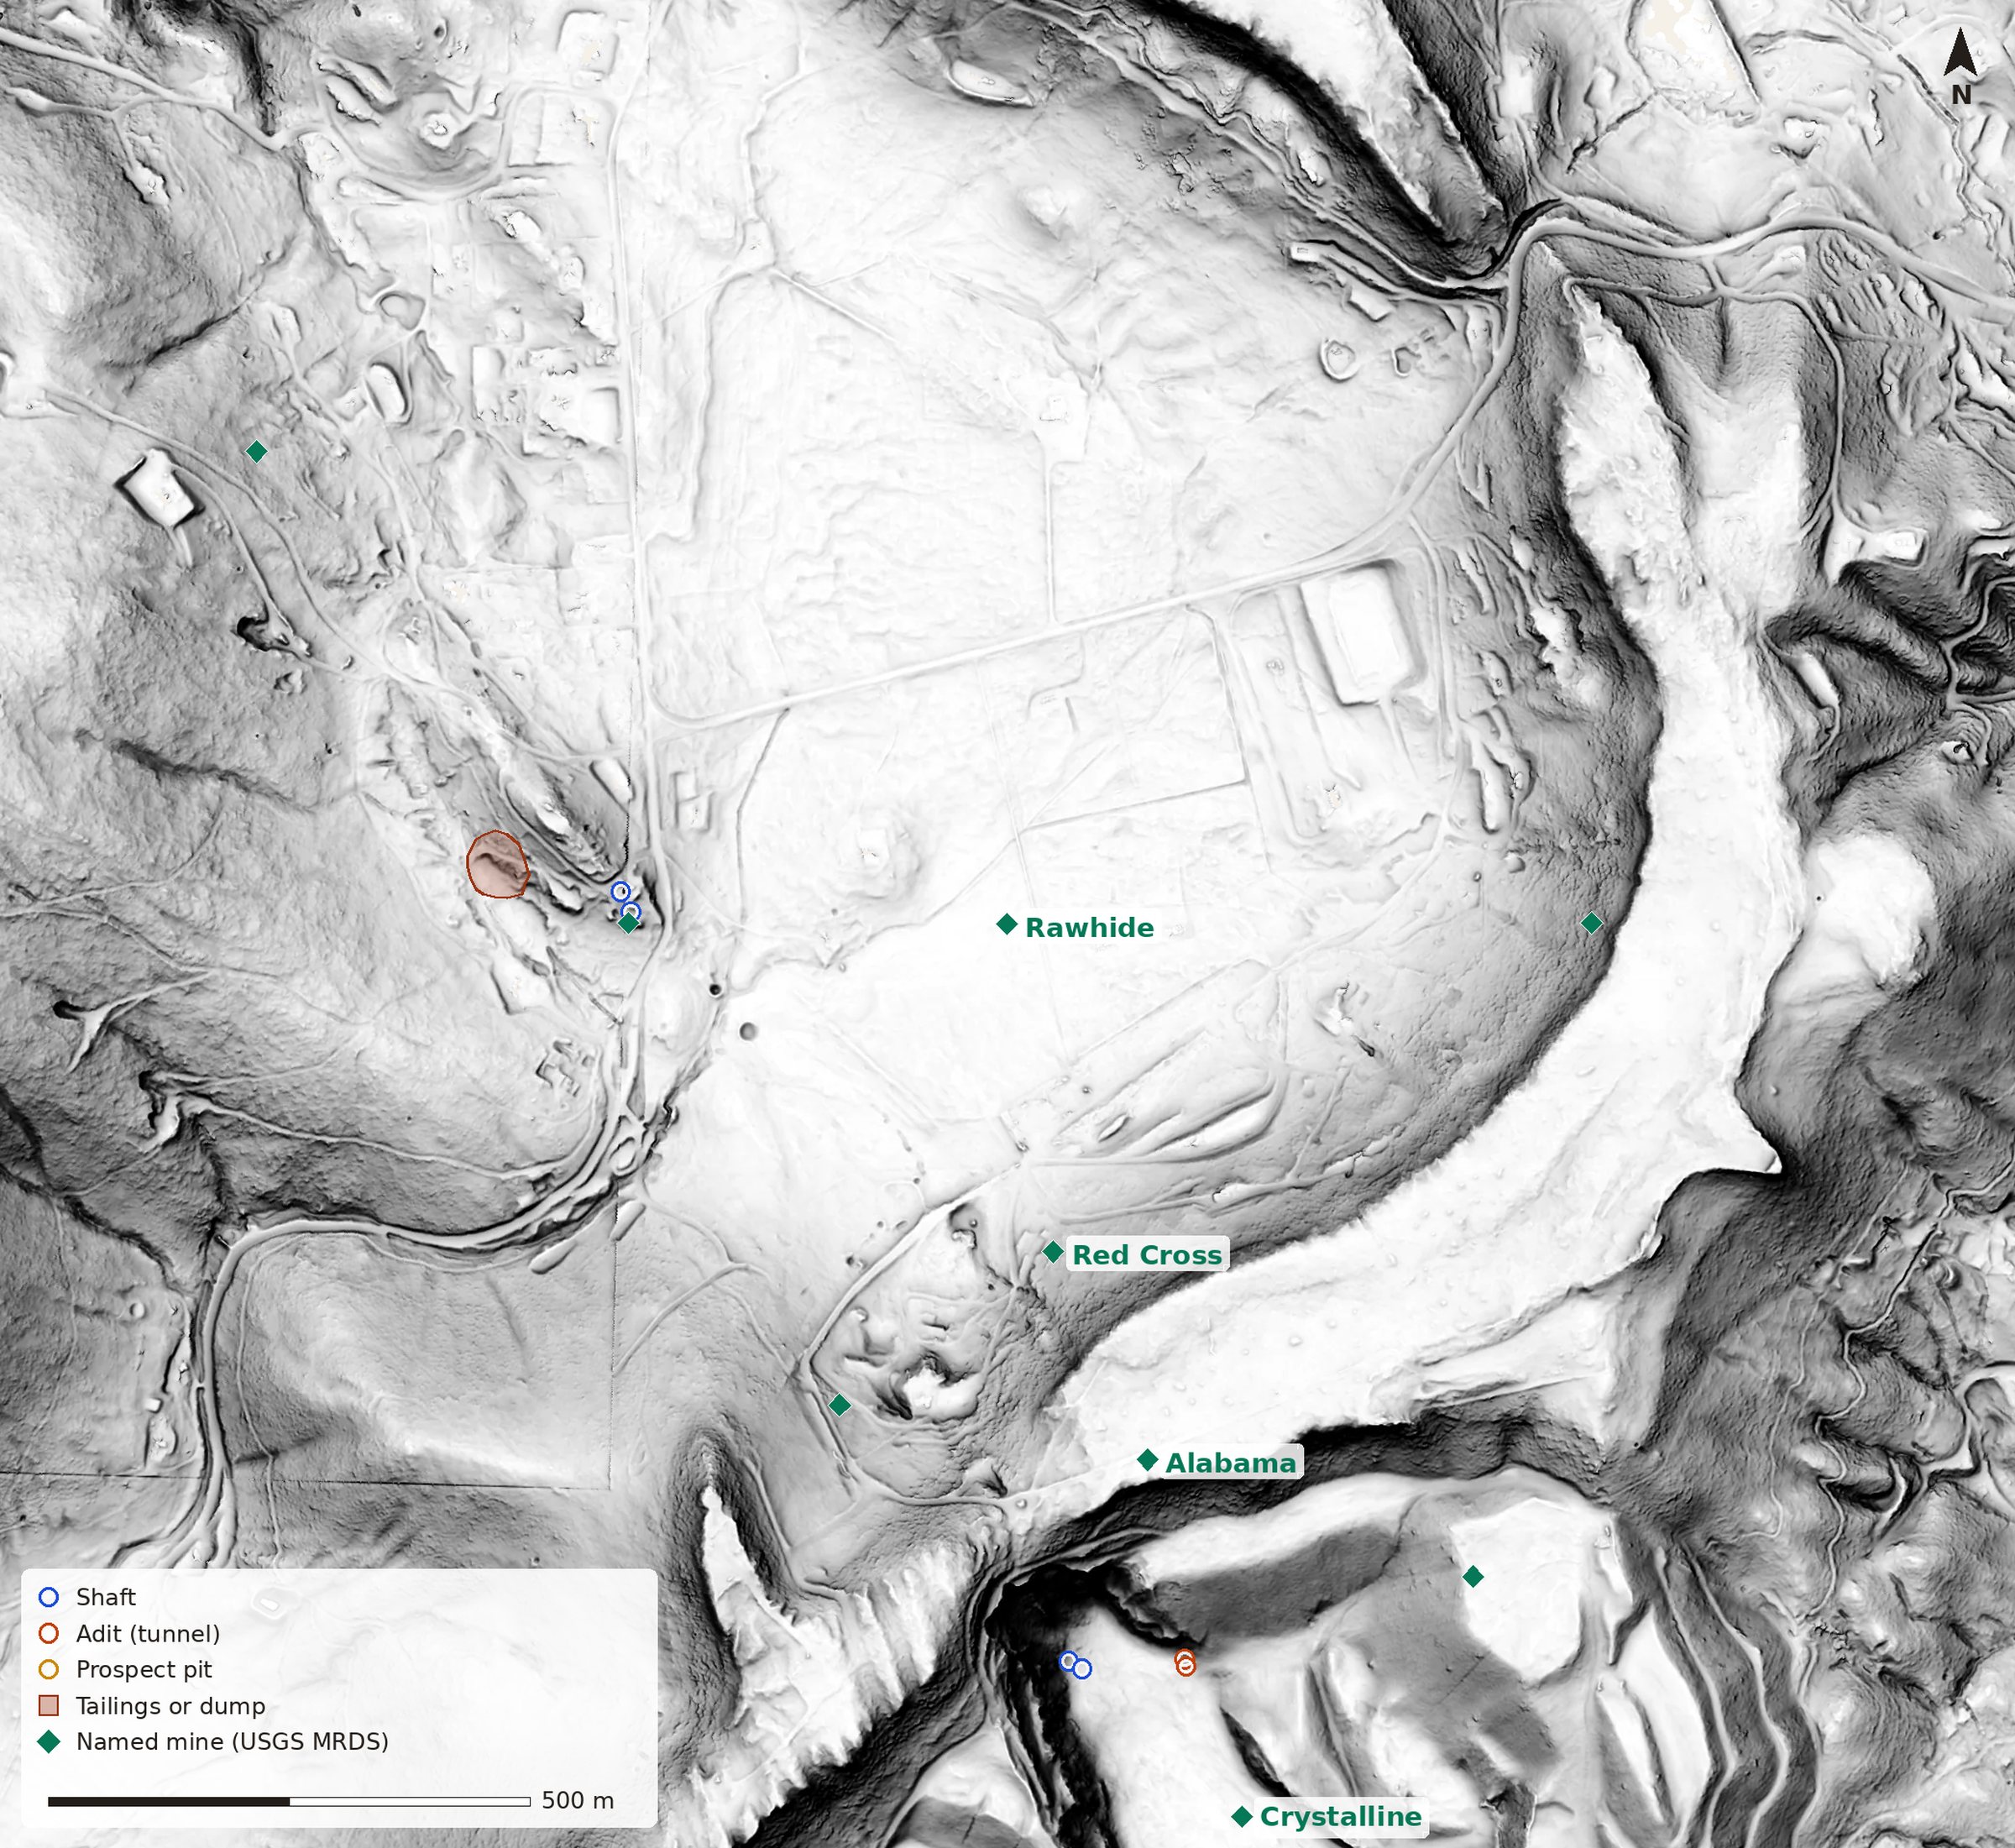
The Rawhide, northwest of Jamestown. The long, smooth ridge curving across the right side is Table Mountain. Click for full size.
The Rawhide is the classic underground Mother Lode mine: about $6 million in gold, a vein up to 70 feet thick, and a main shaft that followed it 2,000 feet down the incline. Underground mines leave less on the surface, so look for the dumps around the shafts.
The long, smooth ridge curving across the right side of this map is the best geology on the whole page: Table Mountain. About 10 million years ago a lava flow ran down an ancient channel of the Stanislaus River and filled it. The softer ground around it has worn away since, so the old riverbed now stands up as a flat-topped ridge 18 miles long. Underneath the lava are the river’s gold-bearing gravels, and miners went after those too, washing them out at the edges and tunnelling in under the ridge.
Please look from the road
The mine symbols come from topo maps drawn decades ago, so they show what a surveyor saw then. Some of these features are gone, many sit on private land, and old shafts are genuinely dangerous. The map is for looking, not for going.
What’s next
Next I want to draw the Melones Fault Zone and the rock units underneath all of this, so you can see the mines line up along the fault. After that, maybe Nevada: I went to UNR, and the Nevada Bureau of Mines and Geology there publishes its maps and mining-district data for anyone to use.
How it works: USGS 3DEP lidar (surveys CA_SierraNevada_12_B22 and CA_CalaverasTuolumne_2011) streamed from the Entwine Point Tile archive on AWS with PDAL on GitHub Actions; ground returns only, gridded at 1 m, with the 2011 survey filling the 2021–22 survey’s gaps. The relief views come from Project Kiva. Mine features from USGS USMIN and the Mineral Resources Data System, read from the USGS web feature services. Every fact on the page was checked against its source before it went up. The code is on GitHub.
Go deeper
USGS 3D Elevation Program lidar, read from the USGS 3DEP archive on AWS. Mine features from USGS USMIN and the Mineral Resources Data System.
Mother Lode and Table Mountain (Wikipedia) · Columbia State Historic Park (California State Parks) · Columbia, Jamestown and Big Oak Flat districts (Oakland Museum of California) · The Harvard pit lake (USGS Open-File Report 01-074) · Jamestown Mine closure (Central Valley Water Board) · Big Oak Flat marker (HMdb) · Eagle-Shawmut Mine (Western Mining History)
“All That Glitters?” (BackStory) — what happened in California after the gold was found, and what it left behind.
“California Gold Rush” (Dan Snow’s History Hit) — the big-picture story in one episode.
“South of the Mother Lode” (KVPR, Central Valley Roots) — the gold camps south of here, from Mariposa County down to the Kern River.
Environmental Impact of the California Gold Rush (C-SPAN Lectures in History, on the Internet Archive) — a full college lecture on the environmental cost of the Gold Rush, hydraulic mining above all.
“Mercury in Our Waters” (PBS SoCal, Earth Focus) — the mercury the gold miners used is still working its way through California’s rivers.
Groveland Yosemite Gateway Museum · Columbia State Historic Park · Groveland: South of the River (Tuolumne County Historical Society)
A Short Mining History and Geology of the California Gold Rush (Garry Hayes, Geotripper) — a Modesto Junior College geology instructor on how the gold got there and how it came out. · Groveland and Big Oak Flat (Images of America, Southern Tuolumne County Historical Society) · Chispa, the Tuolumne County Historical Society’s quarterly (CSU Stanislaus archives)
Related: Project Kiva, the same lidar trick pointed at archaeology, and AFTERSHOCK, the earthquakes along the faults.
If you’re ever on Highway 49, stop at Columbia and walk out among the rocks. It’s strange, lovely ground, and now I know how it got that way.