I built AFTERSHOCK in April: every earthquake USGS recorded in the last 30 days, magnitude 1.5 and up, on a dark map, with a leaderboard of US states. It worked, and it looked the part. Six months later I went back with two questions. Could it show the rest of the world as well as the United States, with a way to pick a country or a region? And were the numbers on it actually telling the truth?
The first was mostly a matter of building. The second turned out to be the interesting one.
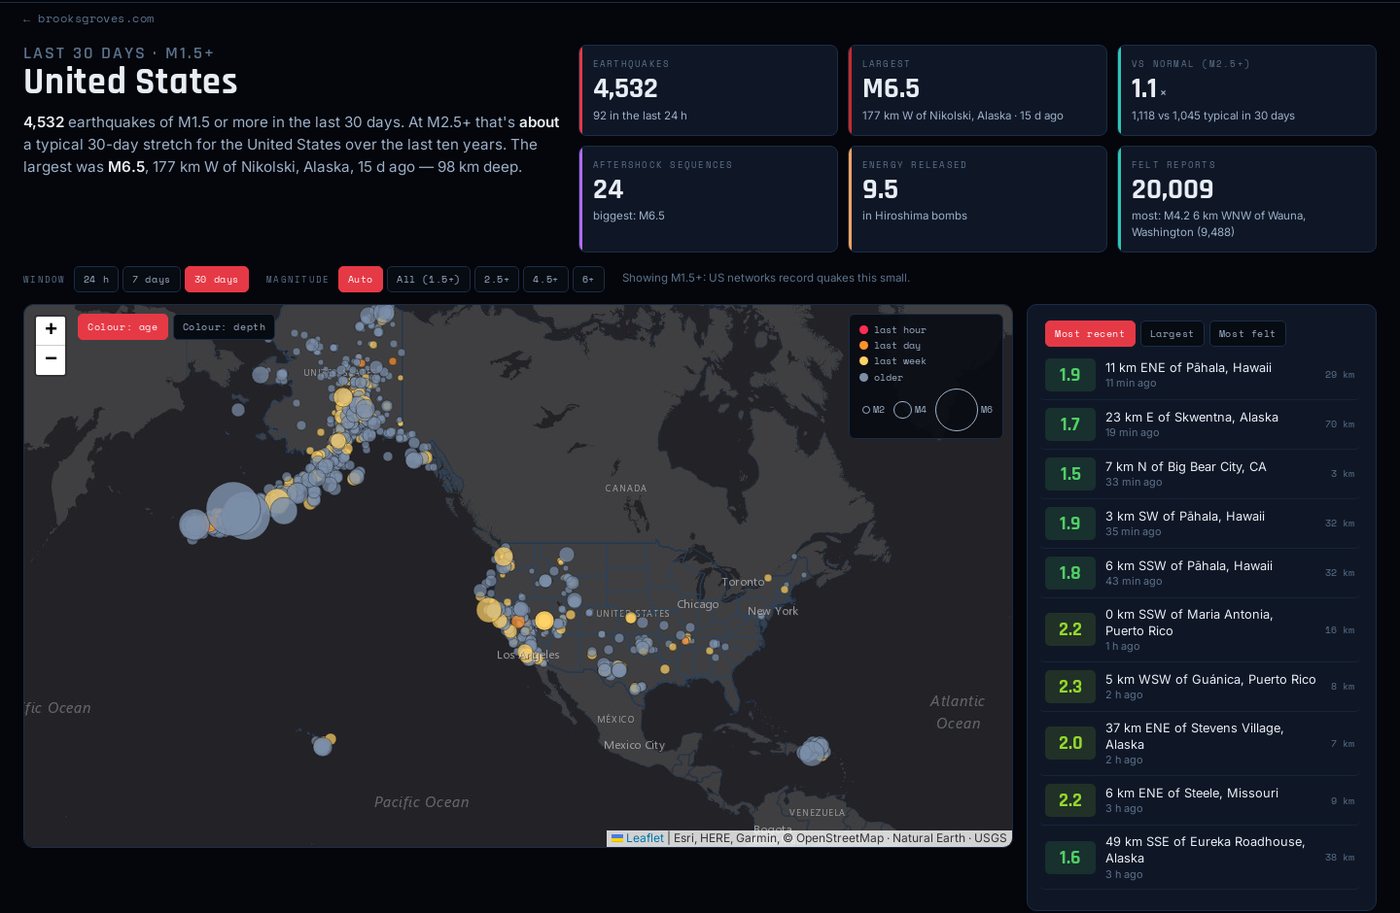
The new AFTERSHOCK, United States view. The picker at the top covers every state and territory, every country with a quake this month, world regions and the open ocean. Every view has its own link.
What it was getting wrong
It was mostly counting seismometers. The old leaderboard said Alaska was always first, “not even close.” Alaska is very active. But USGS’s catalog is complete down to about M1.5 only where the US runs dense networks: Alaska, California, Hawaii, Utah, Nevada, the Pacific Northwest. Across most of the world it’s complete to about M4.5. In the last month there were 79 earthquakes below M4 in the whole catalog outside the US, against 841 at M4 and up. At M1.5, a ranking of places mostly measures how many instruments each one has.
So the comparisons now happen where the catalog is fair: M2.5 and up between US states, M4.5 and up between countries. The map and the lists still show every quake; only the rankings and “vs normal” use the higher cut.
It was putting Texas earthquakes in New Mexico. States were read from the end of USGS’s place description, and a quake described as “55 km S of Whites City, New Mexico” went to New Mexico. Fifty-five kilometres south of Whites City is Texas, in the Delaware Basin, where most of these quakes happen. AFTERSHOCK now places every quake from its coordinates, using Natural Earth state and country outlines kept in the repo. Offshore quakes go to the nearest country within 250 km, and anything farther out is labelled open ocean (the Mid-Atlantic Ridge, south of the Fiji Islands). In one run, about 180 Permian Basin quakes moved from New Mexico to Texas.
Three smaller problems. The state outlines came from someone else’s GitHub file, and if it didn’t load, the whole page said “DATA UNAVAILABLE.” On a phone the page scrolled sideways. And the energy table in the README was off by about fifteen times: an M4 is about 15 tons of TNT, not one.
Is this normal?
A count by itself doesn’t mean much. 45 M2.5+ earthquakes in Texas in a month: a lot or a little? Once a week the pipeline now pulls the last ten complete years and counts them the same way, by state at M2.5+ and by country and region at M4.5+. Every view shows the daily count against that average and ten years of annual totals, with this month’s pace beside them.
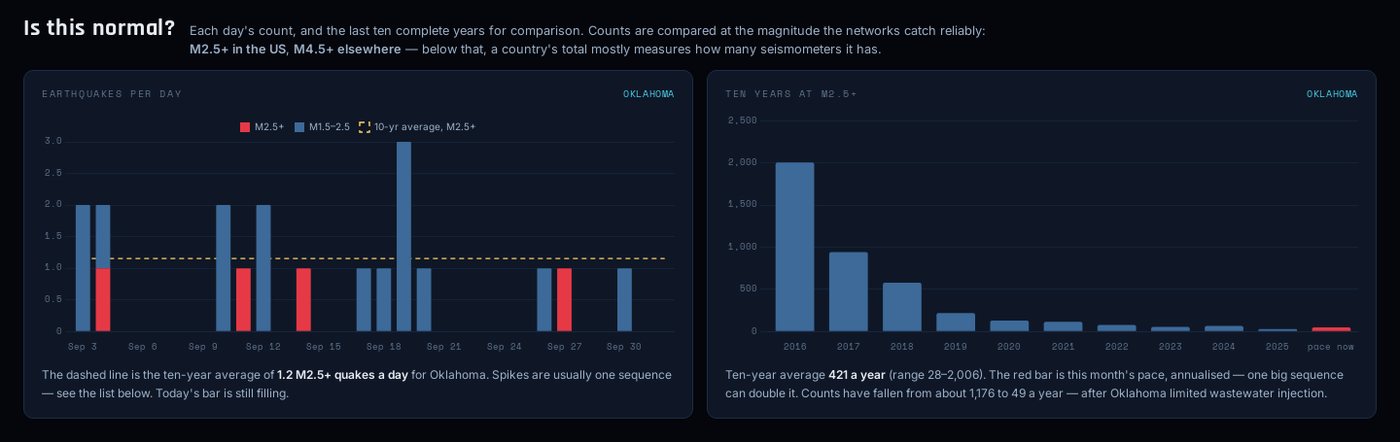
Oklahoma at M2.5+: 2,006 earthquakes in 2016, 28 in 2025.
The baselines turned out to be the best part of the rebuild, because they tell stories. In Oklahoma, an earthquake surge set off by injecting oil-field wastewater deep underground peaked in 2015–16. After the state ordered operators to cut injection, the count fell: 2,006 M2.5+ earthquakes in 2016, 28 in 2025.
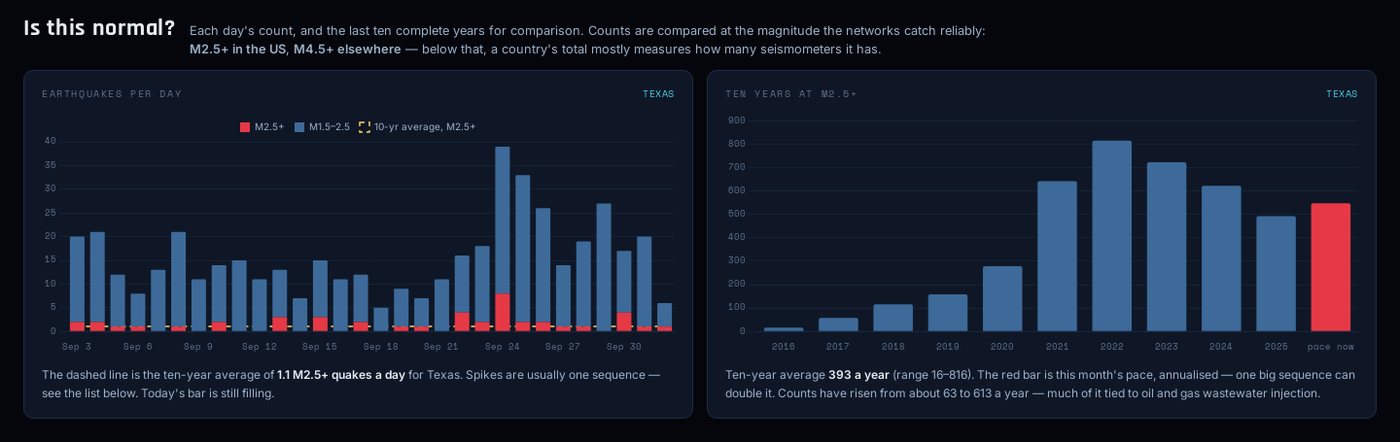
Texas went the other way: 16 in 2016, 816 in 2022, 493 last year. This month is running a little above the ten-year average.
Texas went the other way, and for the same reason: 16 M2.5+ quakes in 2016, 816 in 2022, 493 last year. Most of them are in the Permian Basin, the ones I had been filing under New Mexico. Other years stand out for natural reasons: Hawaiʻi in 2018 (12,823, during the Kīlauea summit collapse), California in 2019 (Ridgecrest), Puerto Rico in 2020, Nevada in 2020 (Monte Cristo Range).
Right now the United States as a whole is running at about 1.1 times normal at M2.5+, and the world about 0.9 times normal at M4.5+. Alaska is at about twice its usual rate. That’s the Aleutians.
Aftershocks, for real this time
The project is called AFTERSHOCK, and the homepage card has promised “aftershock-sequence analysis” for months. It didn’t have any. Now it does. The pipeline works through the catalog from the largest quake down. Each main shock claims the smaller quakes inside its Gardner–Knopoff window, a distance and a length of time that both grow with magnitude: 58 km and about two years for an M6.3. Counts only include quakes above the region’s completeness magnitude, so sequences in different places can be compared.
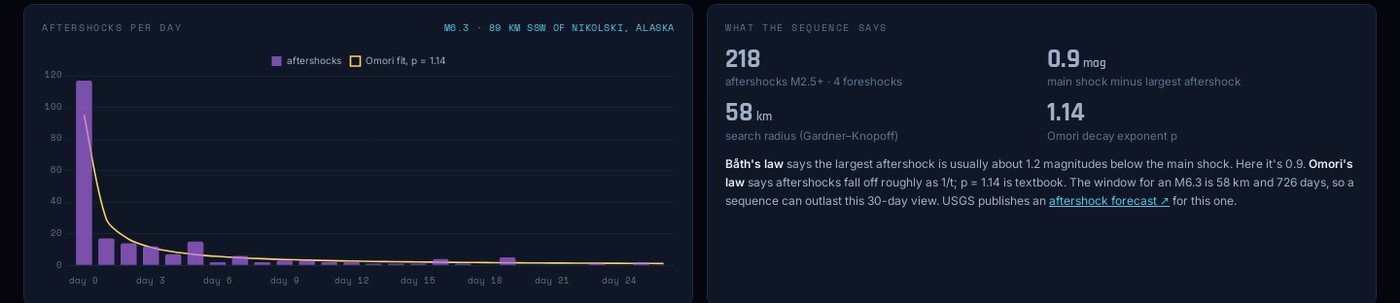
The M6.3 south of Nikolski in the Aleutians, September 3: 218 aftershocks M2.5+ in four weeks, falling off almost exactly as Omori’s law predicts.
Each sequence is checked against two old rules. Omori’s law (1894) says aftershocks fall off roughly as one over time. The September 3 Aleutian M6.3 fits with an exponent of 1.14, close to textbook. Båth’s law says the largest aftershock is usually about 1.2 magnitudes smaller than the main shock. Here it was 0.9. When that gap is under half a magnitude, the page labels the sequence a swarm, because it behaves less like one fault breaking and more like fluid or magma working its way through rock. Both of this month’s West Texas sequences are swarms by that test, which fits the injection story.
One contrast I didn’t expect: the M6.5 west of Nikolski two weeks later, the largest US quake of the month, has had only seven aftershocks. It was 98 km deep, inside the Pacific plate as it sinks under Alaska. Deep earthquakes are known for having few aftershocks, and you can see it here.
The shape of the shaking
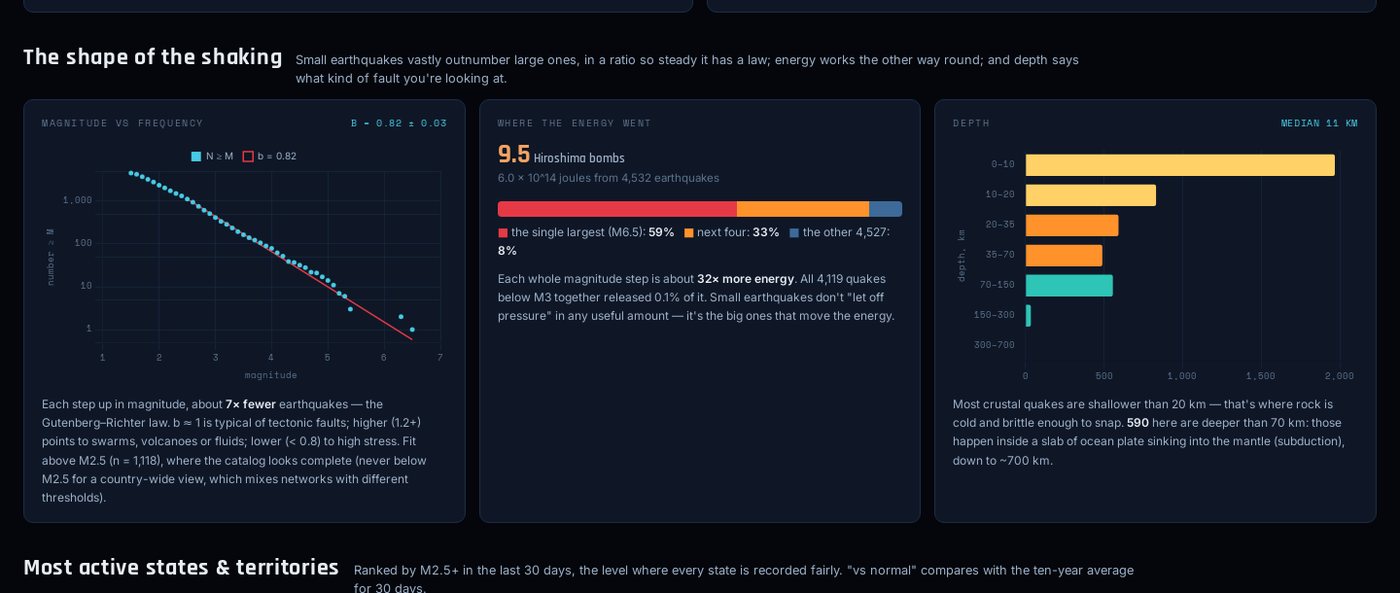
Gutenberg–Richter, energy and depth, recalculated for whatever place you pick.
Three panels are recalculated for whatever place you pick. The Gutenberg–Richter plot shows how many quakes there were at or above each magnitude, with a b-value fitted above the point where the catalog is complete. A b near 1 means about ten times fewer quakes for every step up in magnitude, which is typical of tectonic faults. Higher values point to swarms, volcanoes or fluids.
The energy panel answers a question people often get wrong. Each step in magnitude is about 32 times more energy, so the biggest quake dominates. In the US this month the single M6.5 released 59% of all the seismic energy, and more than four thousand quakes below M3 together released about 0.1%. Small quakes don’t usefully “let off pressure.” The depth panel separates shallow crustal faulting from quakes inside ocean plates sinking into the mantle, which go as deep as 700 km.
Closer to home, and farther away
The most-felt earthquake in the United States this month was an M4.2 on September 29 under the Key Peninsula, 6 km west-northwest of Wauna, about 28 km down. 9,488 people filed “Did You Feel It?” reports, far more than for anything in California this month. That’s the South Sound: a small quake under a lot of people.
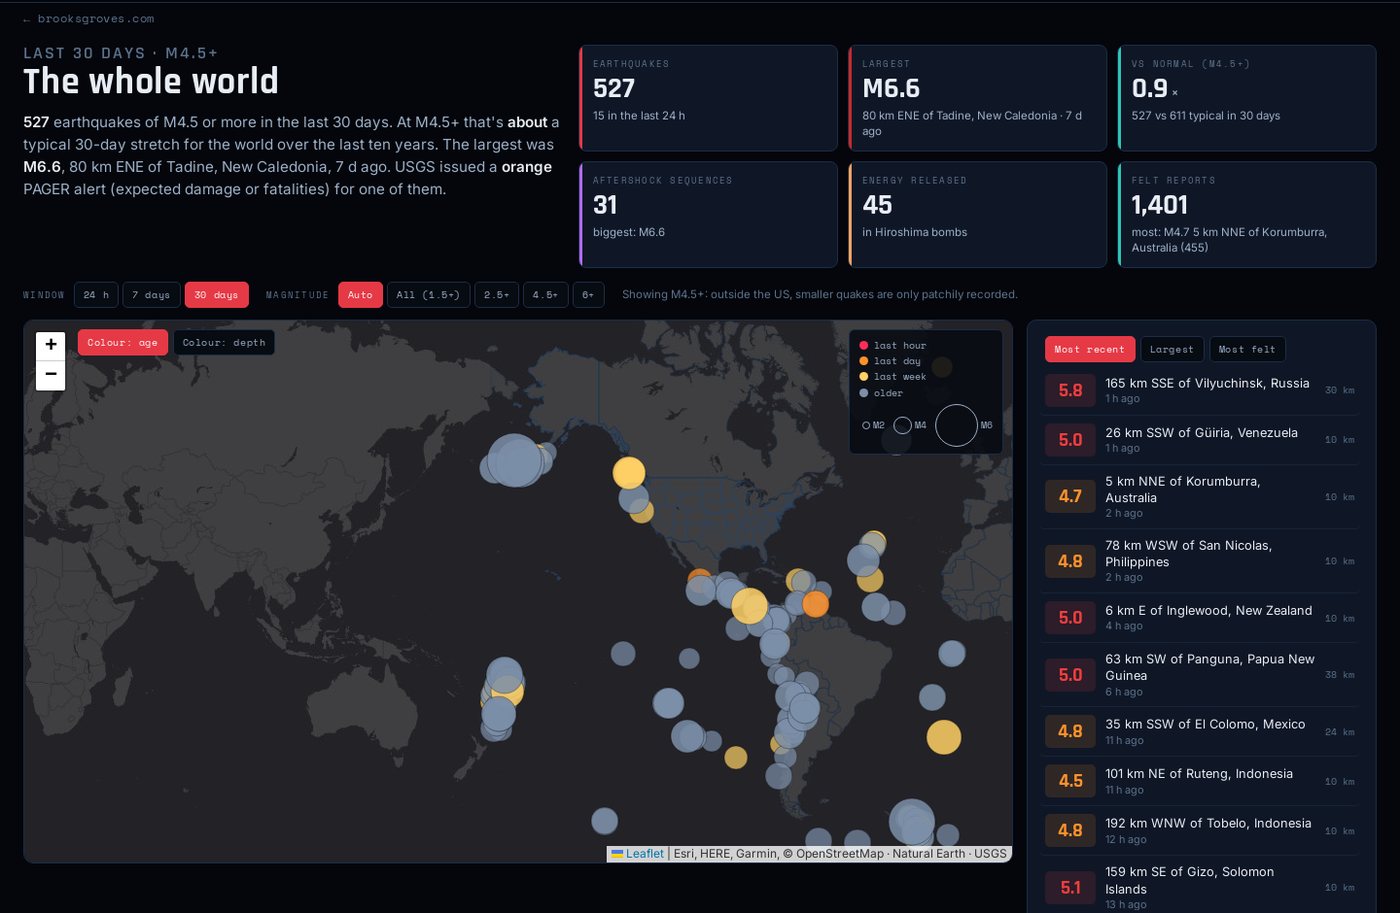
The world view, at M4.5 and up: 527 quakes in 30 days against 611 typical. Outside the US, that cut is what makes countries comparable.
Pick “the whole world” and the Ring of Fire draws itself. The largest quake of the month was an M6.6 off New Caledonia. The one that mattered most was an M5.5 near Jiangyou in Sichuan on September 3. USGS gave it an orange PAGER alert, meaning significant casualties or damage were likely, and the page now says so in the summary.
The quiet places
I kept one line from the first version. Pick a state with nothing in it, Vermont for instance, and the page still says: Quiet is not nothing — it may mean the fault is locked. Now it also tells you how many quakes that state has had in ten years, so you can judge the quiet for yourself.
The Cascadia Subduction Zone hasn’t produced a full-margin rupture since January 26, 1700. AFTERSHOCK watches the small quakes along it every hour, and the margin moves on its own schedule.
AFTERSHOCK is open source at github.com/bdgroves/aftershock and live at brooksgroves.com/aftershock. The original build story is here.
Go deeper
Geologists Link Oklahoma Earthquakes To Fracking Waste Disposal — Here & Now (WBUR/NPR), 22 April 2015, about 5 min. StateImpact Oklahoma’s Joe Wertz on the moment the state connected its quakes to disposal wells.
Inside Mt Rainier’s most powerful seismic swarm on record — Think Out Loud (OPB), 31 July 2025, about 9 min. A swarm with no main shock, and fluids to blame, explained by USGS’s Alexandra Iezzi.
S1 E9: The Big One with Harold Tobin and Audrey Dunham — FieldSound (UW College of the Environment), 6 July 2023, about 16 min. PNSN’s director on South Sound shaking, magnitude math and Cascadia.
Utsu, T., Ogata, Y. & Matsu’ura, R.S. (1995). The centenary of the Omori formula for a decay law of aftershock activity. Journal of Physics of the Earth 43(1), 1–33. Open access.
Gardner, J.K. & Knopoff, L. (1974). Is the sequence of earthquakes in Southern California, with aftershocks removed, Poissonian? Bulletin of the Seismological Society of America 64(5), 1363–1367.
Gutenberg, B. & Richter, C.F. (1944). Frequency of earthquakes in California. Bulletin of the Seismological Society of America 34(4), 185–188.
Ellsworth, W.L. (2013). Injection-induced earthquakes. Science 341, 1225942.
Langenbruch, C. & Zoback, M.D. (2016). How will induced seismicity in Oklahoma respond to decreased saltwater injection rates? Science Advances 2(11), e1601542. Open access.
Skoumal, R.J., Barbour, A.J., Brudzinski, M.R., Langenkamp, T. & Kaven, J.O. (2020). Induced seismicity in the Delaware Basin, Texas. Journal of Geophysical Research: Solid Earth 125(1), e2019JB018558.
In West Texas, a boom in earthquakes alongside a boom in oil drilling — KUT / Marfa Public Radio, Travis Bubenik, 2 January 2023; the Permian story on the ground.
USGS ComCat — the catalog behind every count. · USGS FDSN event service — how the ten-year baselines get pulled. · USGS real-time GeoJSON feeds — the two-minute refresh.
Did You Feel It? — where those 9,488 Key Peninsula reports went. · USGS PAGER — the alert colors for impact. · Natural Earth — the state and country outlines in the repo.
Oklahoma Geological Survey: Earthquakes — the state’s own network. · TexNet — Texas’s seismic network and injection research. · Pacific Northwest Seismic Network — closer to home.
AFTERSHOCK live dashboard — the page itself. · AFTERSHOCK on GitHub — this project’s code.