This is the third of my old-language weather and water projects. SIERRA-FLOW does Sierra Nevada rivers in COBOL, and CASCADIA-WX reads the Northwest’s weather balloons in FORTRAN. I wanted one more that I could check against something real every single day, and I live a few miles from the water. So PUGET-TIDES follows the tide in from the Pacific at eight NOAA gauges, from Neah Bay at the tip of the Olympic Peninsula, through the Strait of Juan de Fuca, past the San Juans and Port Townsend, and down the Sound to Seattle and Tacoma.
Making a tide table
A tide looks like one wave that comes and goes twice a day, but it’s really the sum of dozens of smaller, steady waves, each keeping time with something the moon or the sun does. The biggest, called M2, follows the moon’s twice-a-day pull. Others follow the moon swinging north and south of the equator, the moon coming closer and going farther, the sun, and the 18.6-year wobble of the moon’s orbit. NOAA has measured the size and timing of 37 of these at every gauge. Add them up for any moment and you have the tide.
That’s how tide tables have always been made. Lord Kelvin built a brass machine of pulleys and gears to add the waves up in 1872, and the Coast and Geodetic Survey printed America’s tide tables on one, nicknamed Old Brass Brains, until the mid-1960s. PUGET-TIDES does it in FORTRAN: it works out where the moon and sun are from scratch, applies the corrections for the moon’s 18.6-year cycle, and adds up all 37 waves at every gauge, every six minutes, a year ahead. All eight gauges take it about two seconds.
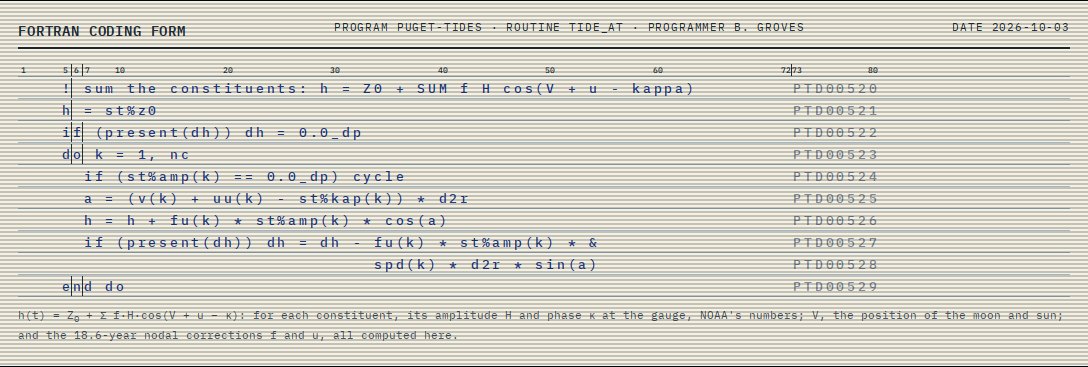
The loop that adds up the 37 waves, copied live from the source onto a 1957 FORTRAN coding form.
Checking its homework
The fun part is that NOAA publishes its own predictions, so every run checks itself. On the first run, FORTRAN found the same 257 high and low tides NOAA lists for the coming week at the eight gauges, every one within 0.8 minutes and a hundredth of a foot. NOAA rounds to the minute, so that’s about as close as two tide tables can agree. Over whole years, FORTRAN’s hourly tide matches NOAA’s to two thousandths of a foot on average.
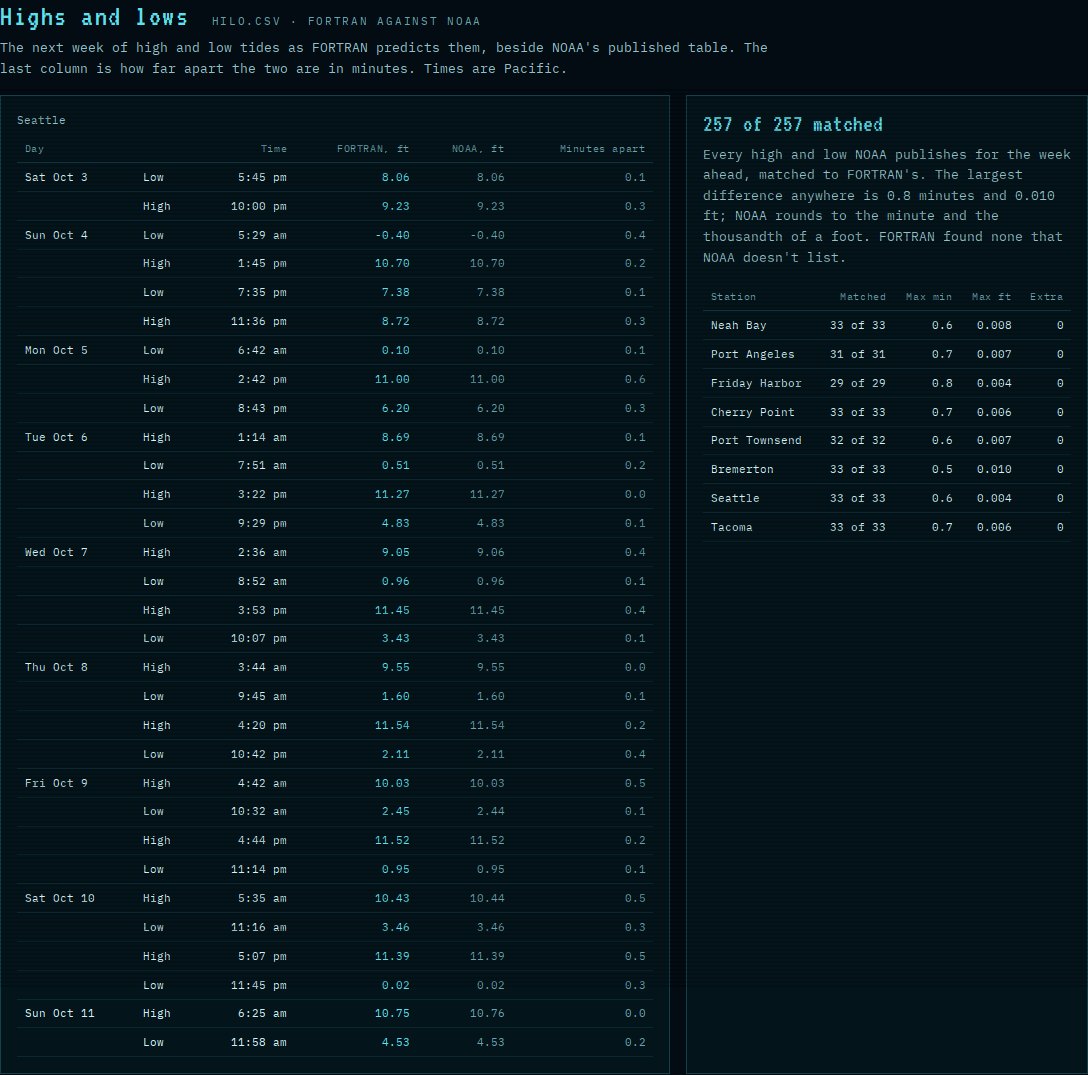
The week ahead at Seattle: FORTRAN's highs and lows beside NOAA's published table, and the check at all eight gauges.
It took one bit of detective work to get there. At first FORTRAN was off by up to a third of a foot in some years, always in the same small wave, M1. Fitting a year of NOAA’s predictions showed the difference was exactly the position of the moon’s nearest point on January 1. NOAA starts that one wave each year without it, then lets it run at a speed that includes it. Once FORTRAN did the same, the two lined up. I’d never have found that without a whole year to compare against.
One more small thing: where the tide just stands for an hour, with a “high” and a “low” a hundredth of a foot apart, NOAA’s tables leave the pair out, so FORTRAN does too, and the check counts any extras it finds.
What the weather adds
The measured water level is almost never exactly the tide. The difference is the surge: wind piling water up, low air pressure letting the sea rise (about a foot for every 30 hectopascals), river water pouring in. FORTRAN subtracts its tide from every six-minute reading for the last month, and a second program, NORMALS, did the same for 1.78 million hours of readings from 1991 to 2020, so each day’s surge can be compared with thirty years of the same weeks.
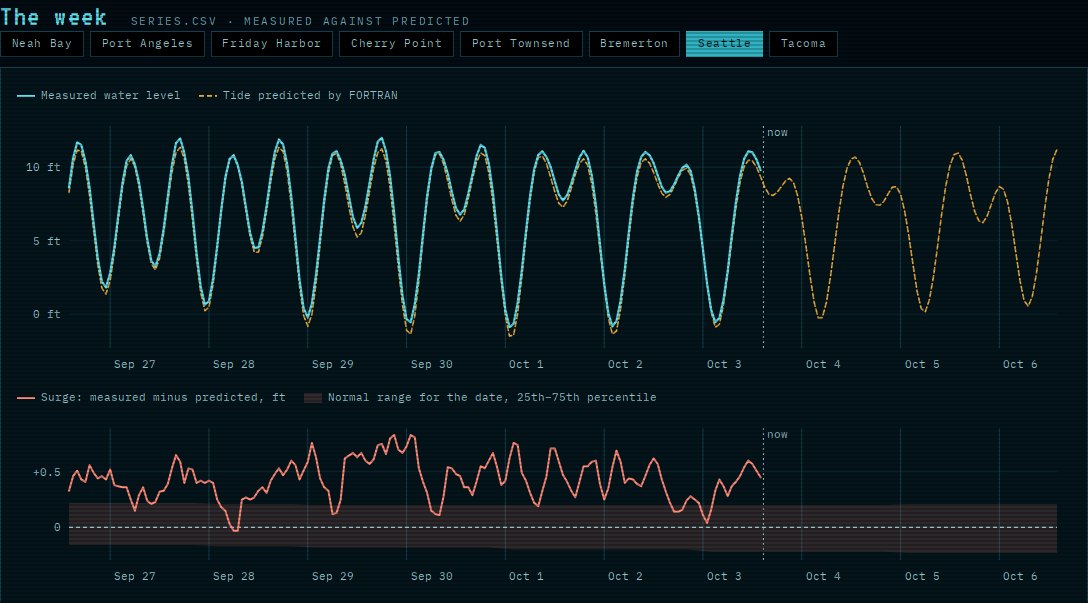
A week at Seattle. Top: the measured water over FORTRAN’s tide. Bottom: the difference, the surge, against the normal range for these dates.
This afternoon the water at Seattle, Tacoma and Port Townsend was running about a third of a foot above the tide, a little more than usual for early October. The biggest surge on record here came on the morning of December 27, 2022. The tide alone was due to reach 12.90 feet at Seattle; the storm added another 2.2 feet, and the gauge read 15.12 feet, the highest water in a record that goes back to 1899. Friday Harbor, Port Townsend, Bremerton and Tacoma all set their records the same day.
Looking ahead
King tides. FORTRAN looks a year ahead for the highest tides. Seattle’s biggest this winter is January 25 at 7:15 in the morning, 13.1 feet, with December 26 close behind. Put a winter storm on top of one of those and the waterfront floods.
Minus tides for the tide pools. My favorite part. FORTRAN finds every low tide below zero that comes while the sun is up, using its own sunrise and sunset. Right now the answer for Seattle is none until March 12, because in fall and winter the big low tides come in the middle of the night. By summer they’ve swung round to midday, and the lowest of the year is the morning of the Fourth of July: 3.9 feet below zero at 11:36. That’s a beach walk worth planning.
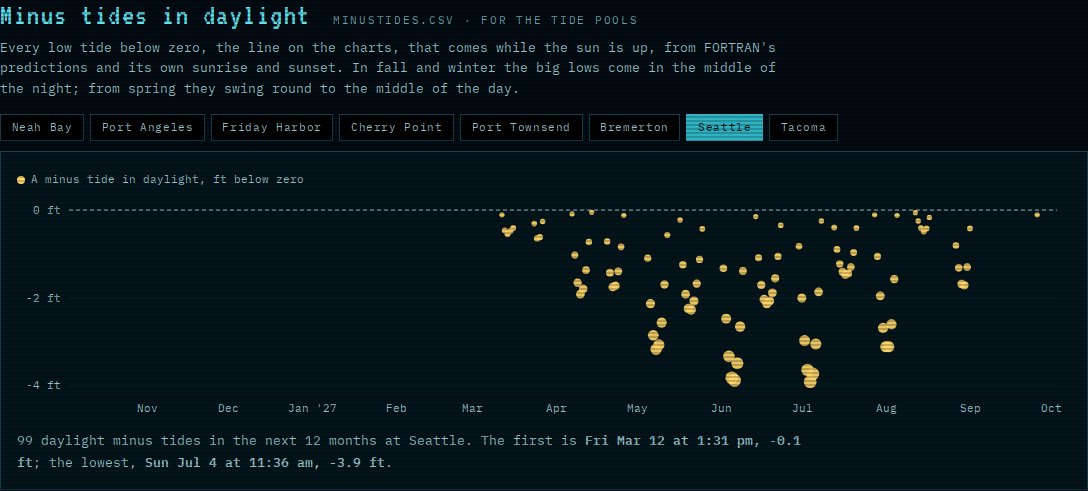
Every daylight minus tide at Seattle in the next twelve months. None until March; the deepest around the Fourth of July.
The tide comes in
The tide is a wave, and you can watch it travel. It reaches Port Angeles about two hours after Neah Bay, Port Townsend in three and a half, and Seattle and Tacoma about four and a third. Along the way it shrinks in the Strait, where the main lunar tide is only two-thirds of the ocean’s, then grows again as Puget Sound’s long inlets funnel it, until at Tacoma it’s almost half again as big as at Neah Bay.
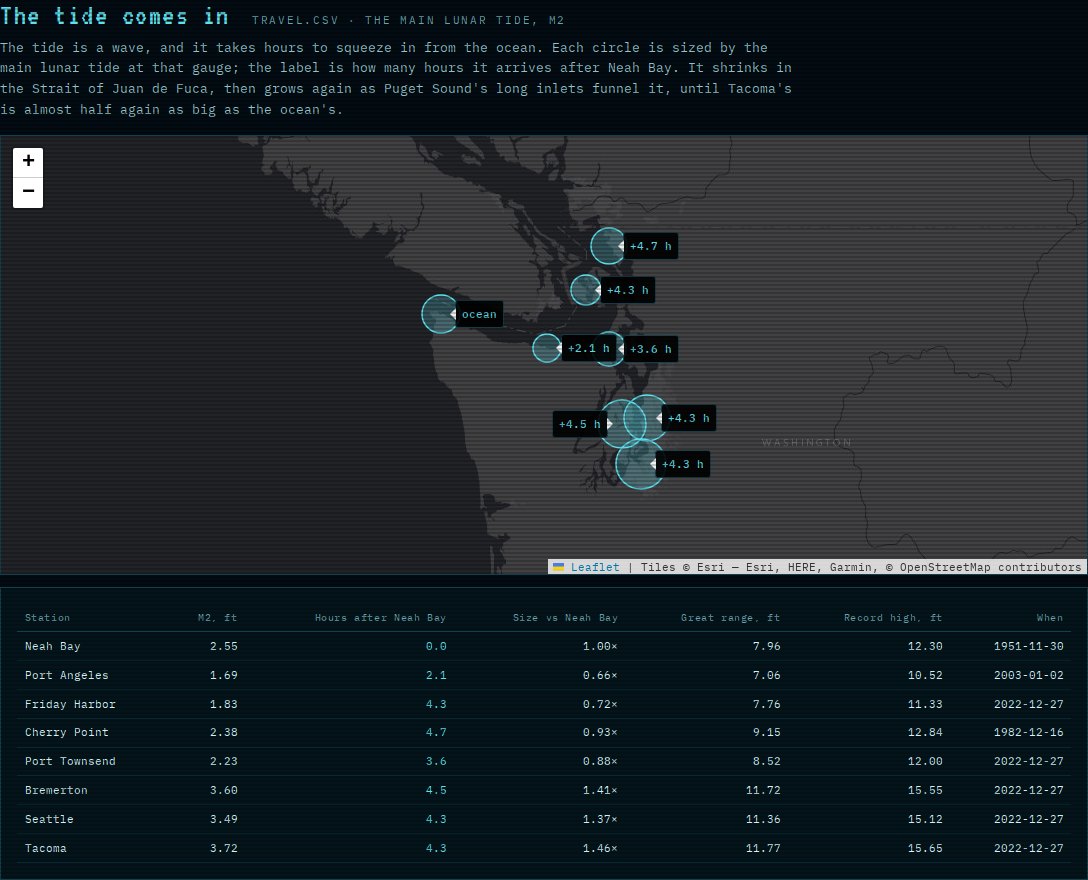
The tide coming in: each circle sized by the main lunar tide, labelled with hours after Neah Bay.
Sea level is moving too. FORTRAN fits a trend to every monthly mean at each gauge, and they come out within 0.05 millimeters a year of NOAA’s published trends. Seattle is up 2.1 millimeters a year since 1899, about eight inches a century. Neah Bay is going the other way, down 1.7 millimeters a year, because the land there is rising faster than the sea.
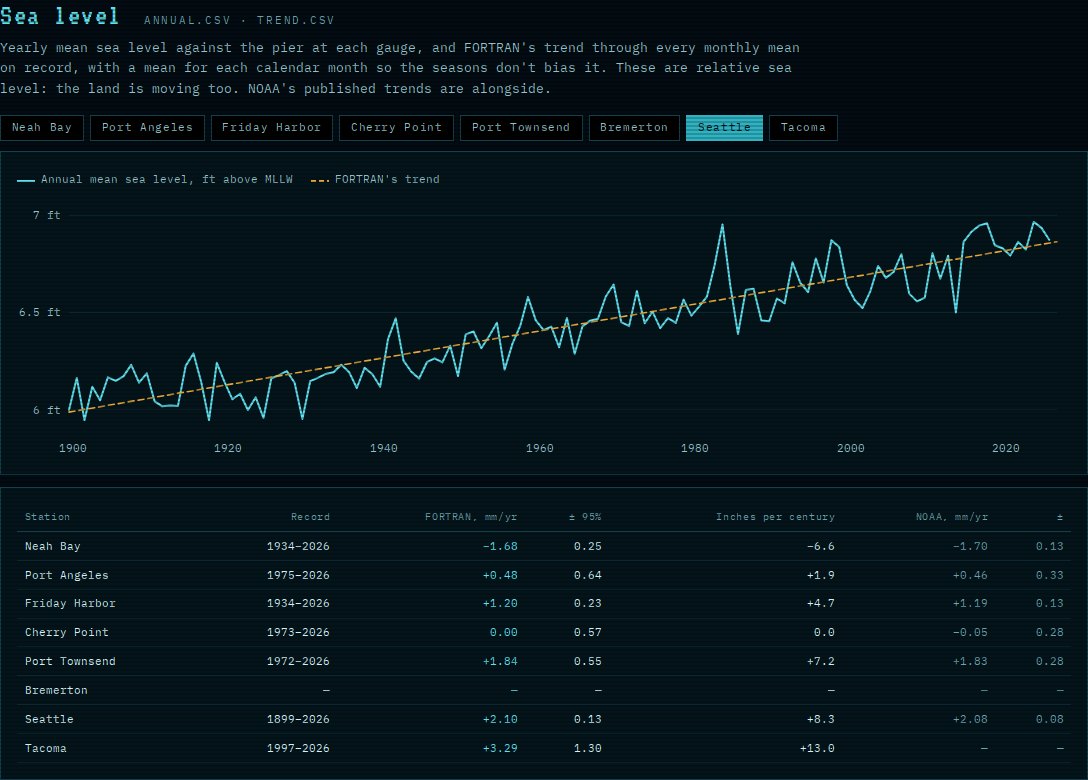
Seattle’s sea level since 1899, with FORTRAN’s trend, and every gauge beside NOAA’s published numbers.
The page
The live page is a cyan cousin of CASCADIA-WX’s amber terminal. It plays back the latest job log, shows each gauge’s water level, tide and surge, draws the week of measured water over FORTRAN’s tide, lists the highs and lows beside NOAA’s, and has the king tides, the minus tides and sea level since 1899. The report comes off a line printer on blue-bar paper, and the loop that adds up the 37 waves is copied live onto a 1957 FORTRAN coding form.
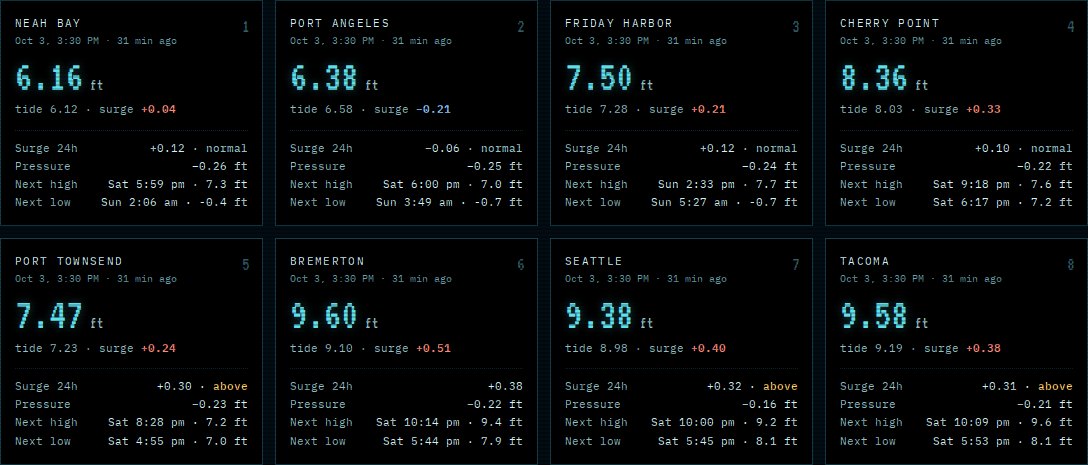
The water now at all eight gauges, in order from the ocean to the end of the Sound.
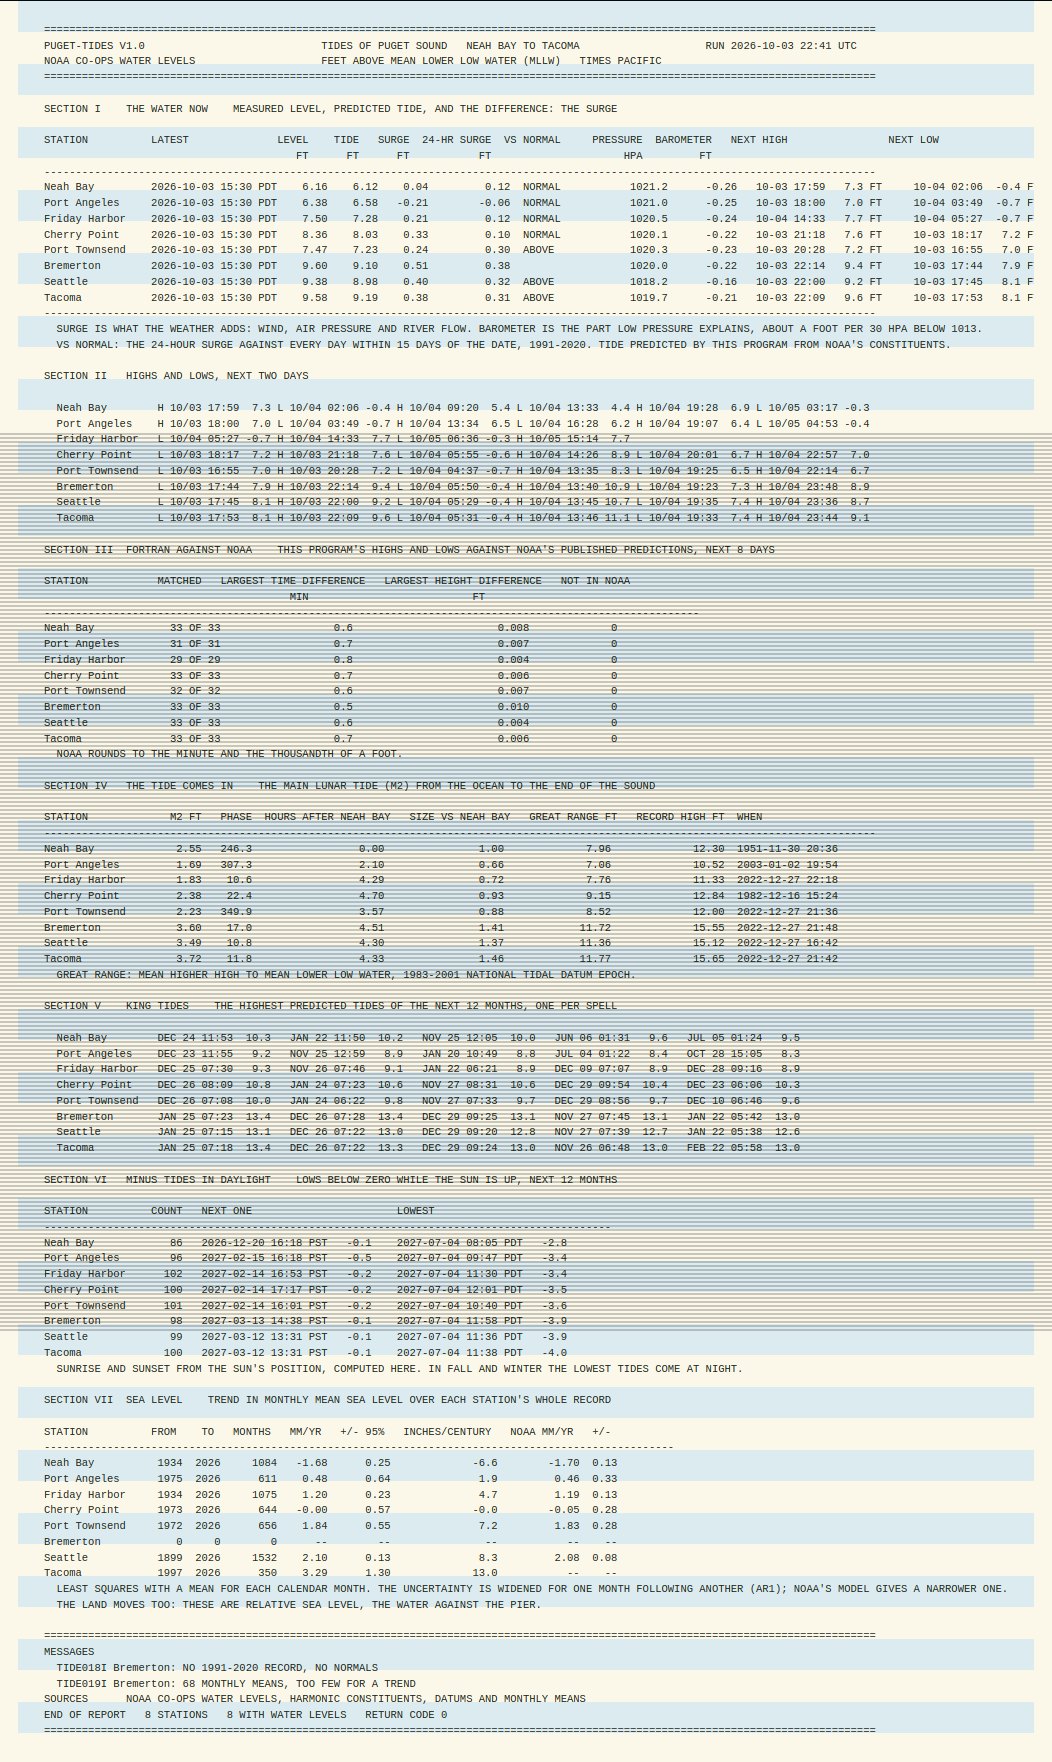
This afternoon’s printout, 132 columns, exactly as FORTRAN wrote it.
How it runs
Every six hours a GitHub Action on Ubuntu runs the batch job: a stdlib-only Python script asks NOAA’s free Tides & Currents API for the constituents, datums and the last month of water levels, GFortran 13 compiles the program, and FORTRAN runs and sets a return code. The normals took about three minutes to build and only need rebuilding once. Bremerton is the one gap: its gauge has no record between 1978 and 2021, so it has no normals or trend, and the page says so rather than guessing. All free, no keys, and not for navigation.
Lord Kelvin’s machine needed a person to turn the crank. This one runs itself, and checks its own answers against the people who still make the official tables.
Code: github.com/bdgroves/puget-tides. The method is Schureman’s Manual of Harmonic Analysis and Prediction of Tides (1958), with the moon’s and sun’s positions from Meeus’s Astronomical Algorithms.
Go deeper
Diving Deeper: Tides and Currents — NOAA Diving Deeper, 18 March 2014, about 12 min. Pat Burke of NOAA’s tides office on how the water-level gauges and the official predictions come together.
Diving Deeper: Nuisance Flooding — NOAA Diving Deeper, October 2015, about 15 min. Billy Sweet on high-tide flooding, sea level rise and how it’s forecast.
NOAA Rewind: Brass Brains — NOAA Rewind, 5 June 2023, about 1 min video. A quick look at Old Brass Brains, the tide machine that printed America’s tables from 1910 to 1965.
Sea level on steroids: Record tides flood Washington coastlines — KUOW, 9 January 2022, about 1 min. John Ryan on low pressure stacking extra water on a king tide, a first taste of the record December 2022 would set.
Mofjeld, H.O. & Larsen, L.H. (1984). Tides and tidal currents of the inland waters of western Washington. NOAA Technical Memorandum ERL PMEL-56. Open access.
Pawlowicz, R., Beardsley, B. & Lentz, S. (2002). Classical tidal harmonic analysis including error estimates in MATLAB using T_TIDE. Computers & Geosciences 28(8), 929–937.
Mazzotti, S., Jones, C. & Thomson, R.E. (2008). Relative and absolute sea level rise in western Canada and northwestern United States from a combined tide gauge-GPS analysis. Journal of Geophysical Research 113.
Tidal Analysis and Prediction — Bruce Parker, NOAA, 2007; the modern successor to Schureman, free from NOAA’s library.
Projected Sea Level Rise for Washington State – A 2018 Assessment — Miller and others, Washington Sea Grant and the UW Climate Impacts Group; why the sea rises at Seattle and not at Neah Bay.
NOAA Tides & Currents — the gauges, constituents and official predictions the program checks itself against. · NOAA Sea Level Trends — the published trends at every gauge.
Seattle gauge 9447130 bench marks — where the record since 1899 is tied to the ground. · CO-OPS data API — free, no key.
PUGET-TIDES live page — the cyan terminal. · Source on GitHub — the FORTRAN that adds up the 37 waves.