Hydrologists don’t keep calendar years. The water year runs October 1 to September 30, so it starts with the autumn rains, builds a snowpack through winter, melts it out in spring and ends with the rivers at their lowest. Water year 2026 ended on Wednesday, so here’s all of it, one day at a time.
This builds on this morning’s flood map, which zoomed in on twenty days of December. This one steps back to the whole year, and the December flood turns out to be part of a bigger story.
Washington, October 1, 2025 – September 30, 2026 · daily flow at 276 USGS stream gauges against each gauge’s normal for the date · snowpack and daily rain from NOAA HRRR · HydroRIVERS network · USGS 3DEP terrain · rendered with forge3d
December 10
in late March
early June
declared by Ecology
What you’re watching
- The rivers are coloured by each USGS gauge’s flow that day compared with its usual flow for that calendar day, the median over every earlier year it has measured. Blue is about normal. Cyan and white mean 3× to 30× normal, and amber means well below.
- The white on the mountains is the snowpack, the water stored in snow on the ground, from NOAA’s HRRR model. It’s nudged onto the ridges using the terrain, since the model works on a 3 km grid.
- The grey-blue veil is the day’s rain.
- Hot pink marks a gauge that beat its highest daily flow on record. Five did, all in the same three days.
A wet year that didn’t feel like one
Here’s the strange part. By the state Department of Ecology’s count, Washington got 104% of its normal precipitation from October through February. It was not a dry winter. But October through February was also the third-warmest on record, back to 1895, and a lot of that water fell as rain on mountains that should have been banking it as snow.
You can see both halves of that in the video. In December the rain runs straight off the mountains and the rivers go white. Up top, the snowpack never fills in the way it should.
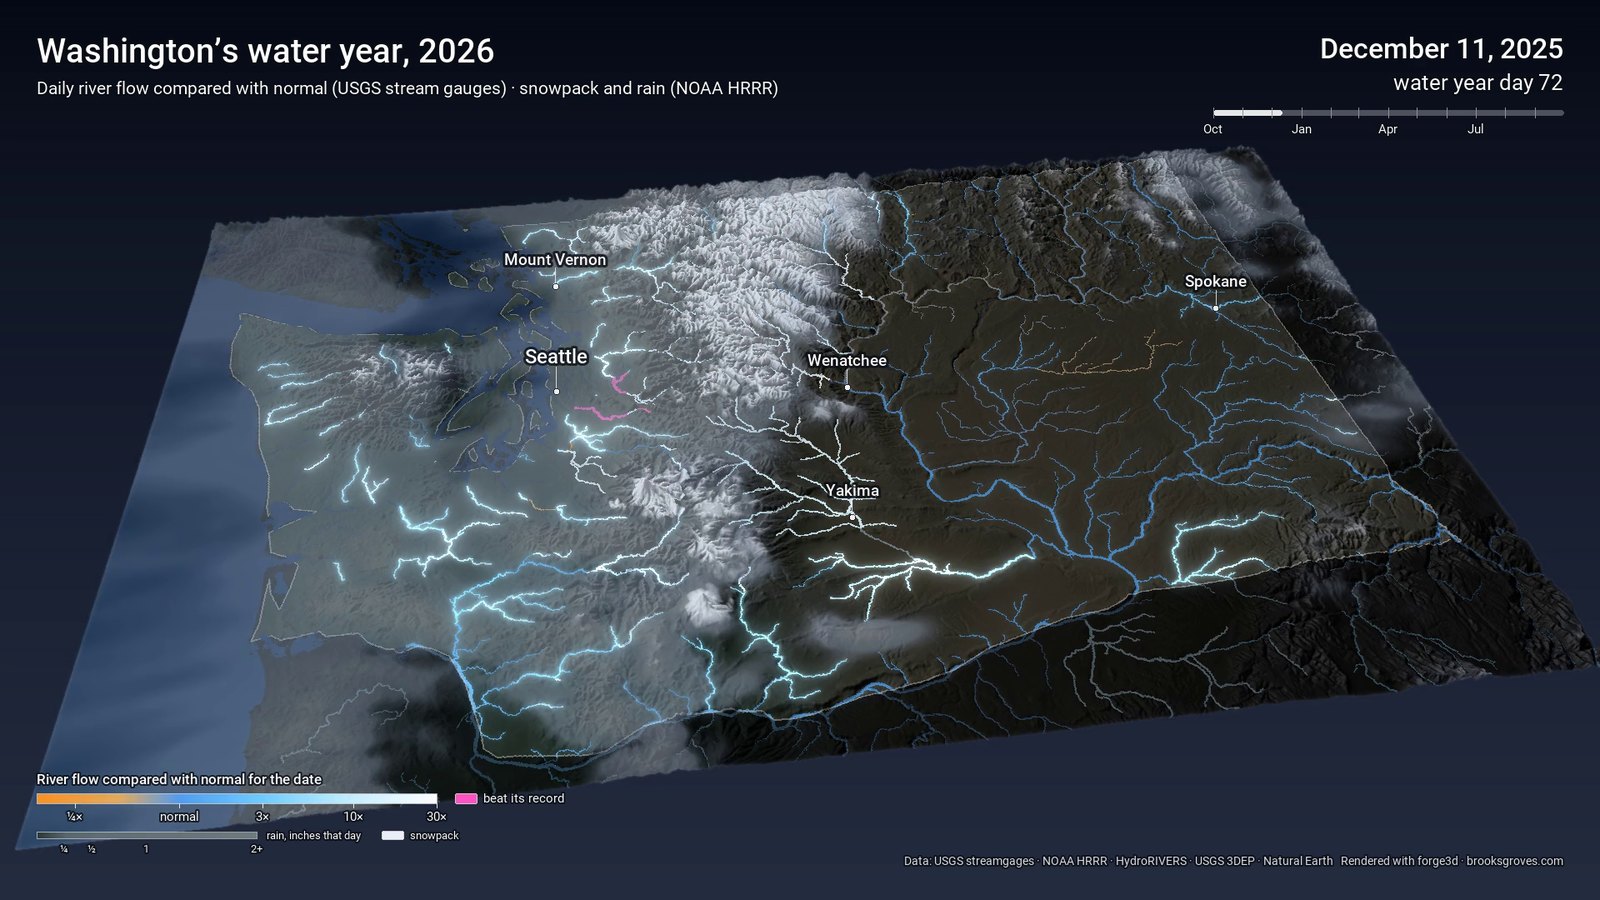
December 11: the atmospheric river. On December 10 the typical gauge in the state ran 6.3× its normal.
December: the records
The atmospheric river of December 8–11 is the brightest stretch of the whole year. On December 10 the median gauge in the state was running 6.3 times its normal flow for the date. Five gauges set new records for their highest daily flow, all between December 10 and 12. The Snoqualmie near Carnation averaged 80,400 cubic feet a second on December 11, against a record of 76,300 from January 2009. The Cedar at Renton carried 10,400 against 8,900 in 1990. Two more gauges upstream on the Cedar, and Skookum Creek in the Nooksack country, set records too. (The flood post has the hour-by-hour version.)
March: the snowpack tops out
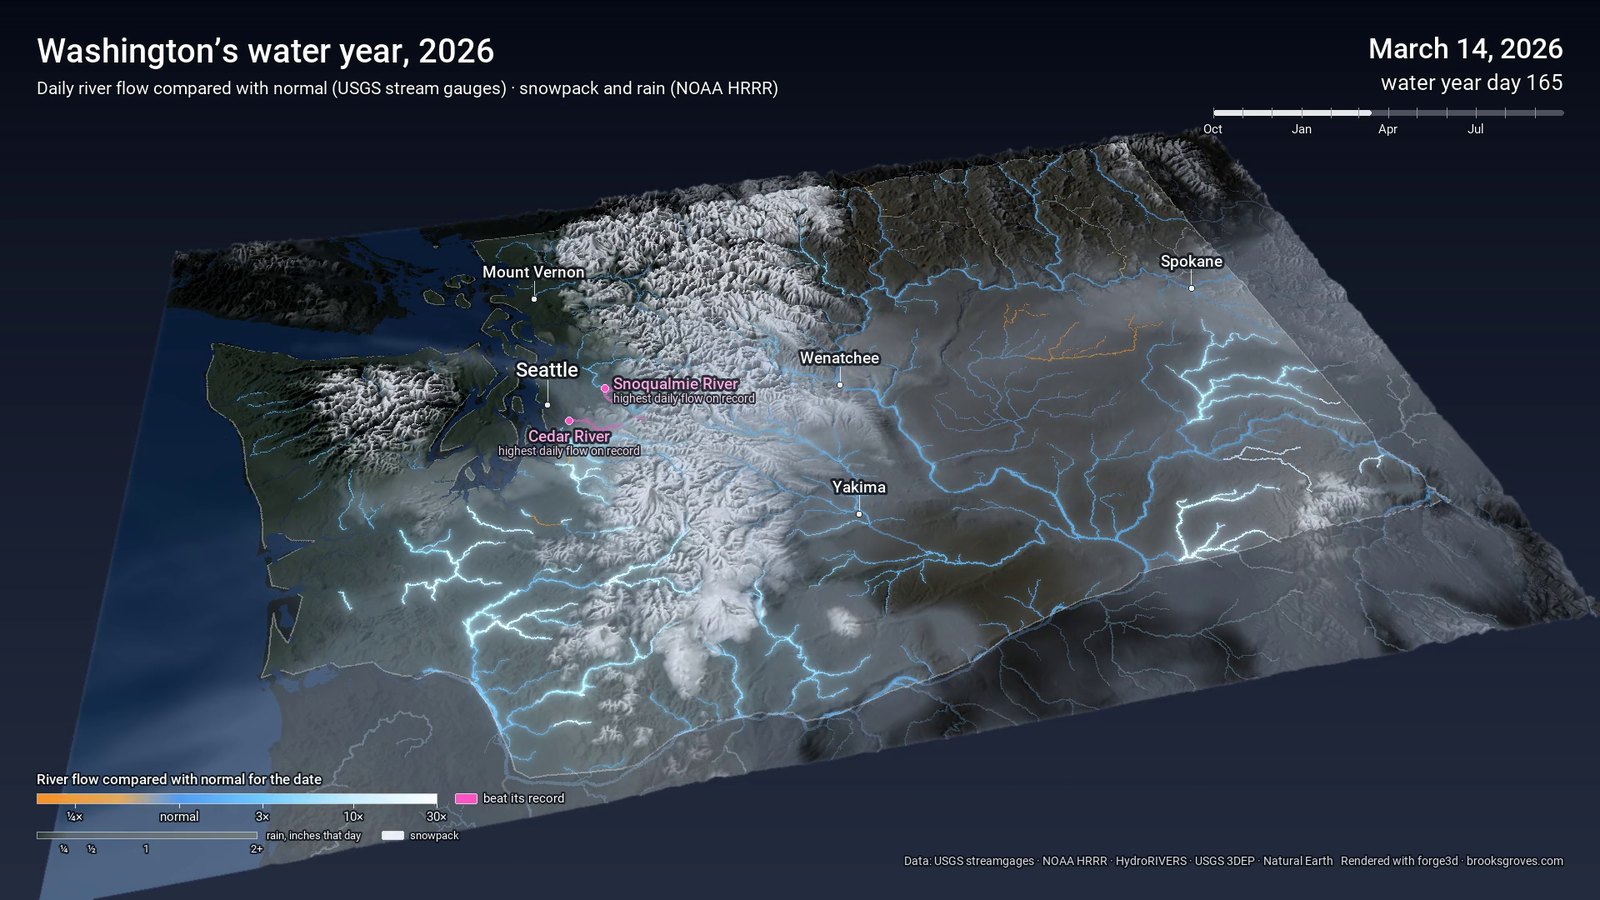
March 14: the snowpack at its biggest in the model, with another storm running rivers high.
In the model, the statewide snowpack peaked around March 14, a couple of weeks ahead of the usual April 1 peak, and there wasn’t much of it. In mid-January the Washington State Climatologist had the snowpack at 66% of normal; by late March Ecology put it near 50%, the fourth-lowest in 40 years. On April 8 Ecology declared a statewide drought emergency, the fourth drought year in a row.
June: amber
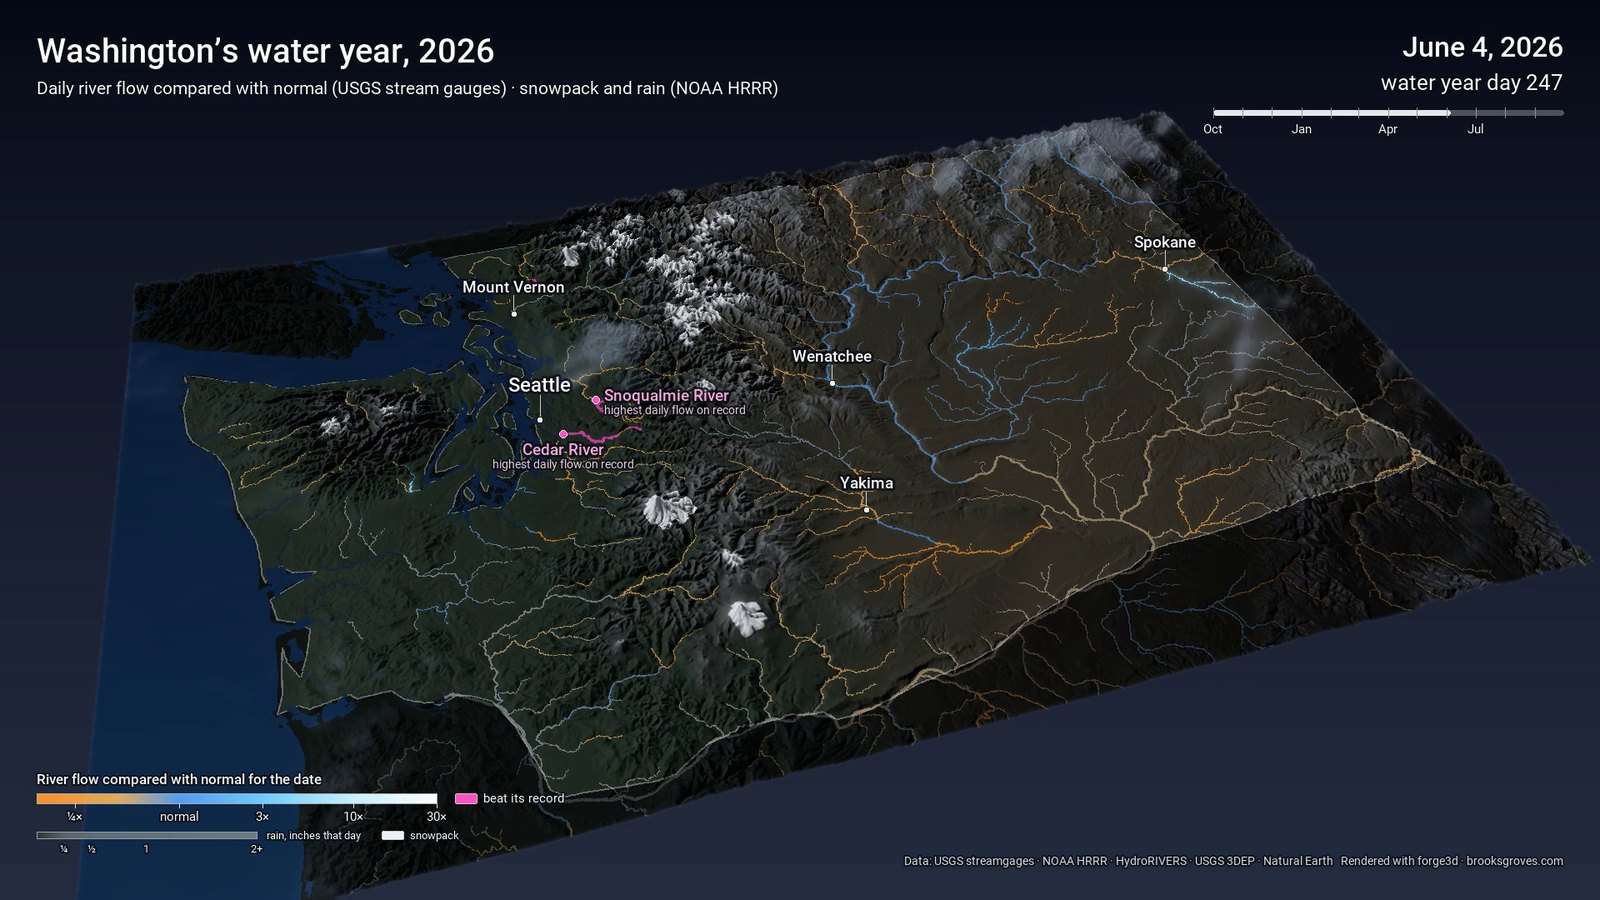
June 4: the typical gauge at 0.47× normal, its lowest of the year. Late spring is when snowmelt should be filling these rivers.
This is where the missing snow shows up. In a normal year, late May and June are when snowmelt carries the rivers east of the Cascades to their high water. This year the snow had already gone, early and fast, and the rivers turned amber instead. On June 4 the typical gauge in the state was running at 0.47 times its normal flow, the lowest point of the whole year. It’s the same water that came down in December, just at the wrong time.
By the end of September, autumn rain is bringing the west-side rivers back to blue and the next water year is about to start.
How it’s built
- Gauges. For 276 active USGS stream gauges in and around the state, the script downloads the whole history of daily flow, some going back to the 1920s. From that history it works out each gauge’s normal for every day of the year (the median for that calendar day, give or take three days) and its highest daily flow before this year.
- Snow and rain. 1,825 fields from NOAA’s HRRR on AWS: one snowpack field each morning, and four six-hour rain totals a day. A byte-range trick downloads just those fields, about a megabyte each, out of files of ~150 MB.
- Rivers. HydroRIVERS, with every reach taking the reading of the first gauge downstream of it.
- Rendering. Four frames a day, so 1,460 frames plus a hold at the end, each rendered twice (the land and rivers, then the rain alone) and combined by a finishing script. Milos Popovic’s forge3d 1.40.1 draws the terrain.
Some honest caveats. The records here are daily means, so they don’t match the instantaneous crests in the news. Summer normals on small, dry-side streams are tiny, so their colours swing hard. Recent USGS numbers are still provisional. And HRRR’s snow is a model estimate, not a snow-pillow reading.
Last thing
A wet year and a drought year at once sounds like a contradiction until you watch it: plenty of water, falling as rain at the wrong time. Water year 2027 started on Thursday. Here’s hoping for a cold, snowy one.
Data: USGS Water Services (daily values); NOAA HRRR via the NOAA Open Data Dissemination program; HydroRIVERS v1.0 (Lehner & Grill 2013); USGS 3D Elevation Program; Natural Earth. Facts: Washington State Department of Ecology, Office of the Washington State Climatologist. Rendering: forge3d by Milos Popovic. Labels: Roboto.
Go deeper
Warm winter liquidates nearly half of Washington state snowpack — KUOW, 6 February 2026, about 4 min. John Ryan with deputy state climatologist Karin Bumbaco: “It’s looking really bleak.”
Northwest looking at a dry spring, summer and fall for agriculture — Northwest Public Broadcasting, 11 March 2026, about 1 min. Anna King on what half a snowpack means for Yakima Valley growers.
Why Snow Matters — Come Rain or Shine (Southwest CASC & NMSU), 5 March 2026, about 38 min. Snow hydrologist McKenzie Skiles on rain replacing snow and melt arriving too early.
Mote, P.W., Li, S., Lettenmaier, D.P., Xiao, M. & Engel, R. (2018). Dramatic declines in snowpack in the western US. npj Climate and Atmospheric Science 1, 2. Open access.
Siler, N., Proistosescu, C. & Po-Chedley, S. (2019). Natural variability has slowed the decline in western U.S. snowpack since the 1980s. Geophysical Research Letters 46, 346–355.
Harpold, A.A., Dettinger, M. & Rajagopal, S. (2017). Defining snow drought and why it matters. Eos 98. The short piece that defines a The short piece that named the “warm snow drought” this year was.ldquo;warm snow drought,The short piece that named the “warm snow drought” this year was.rdquo; which is just what this year turned out to be.
Did record rainfall end Washington’s drought? — Washington Ecology, January 2026; why “there is no substitute for snow.”
The West Faces Snow Drought — NASA Earth Observatory, January 2026; the satellite view, December’s atmospheric river included.
June 2026 Drought and Streamflow Update — Washington State Climate Office; SNOTEL melting out three weeks early and the record-low rivers that followed.
USGS Water Data for the Nation — daily flow, back to the 1920s for some gauges. · NRCS Snow and Water Interactive Map — SNOTEL snowpack, measured on the ground.
Washington Ecology: Drought Response — the 2026 declaration and relief. · Drought.gov: Washington — NOAA’s drought dashboard. · Washington State Climate Office — monthly snowpack and drought summaries.
NOAA HRRR on AWS — snow and rain fields. · HydroRIVERS — the river network. · forge3d — the Python terrain renderer. · wa-water-year — this project’s code.