This is the third Washington map in a row, after the heat dome and this summer’s smoke. It’s the wet one: the first twenty days of December 2025, when an atmospheric river parked over the state and river after river went past anything its gauge had ever recorded.
A lot of people around here remember that week from the inside: the evacuation alerts on their phones, the sandbags, the closed roads, the water in the barn. I’ve tried to keep them in mind.
Washington, December 1–20, 2025 · river flow from 307 USGS stream gauges against each gauge’s normal for the date · hourly rain from NOAA HRRR · HydroRIVERS network · USGS 3DEP terrain · rendered with forge3d
in the Cascades, Dec 8–11
all-time record crests
in Skagit County alone
Snoqualmie at Carnation
What you’re watching
- The rivers are every river in the state draining at least 150 square kilometres, drawn wider as they grow. Each is coloured by its USGS stream gauge, comparing the flow that hour with the usual flow for that date: dim blue below normal, bright blue at normal, then cyan and white at 3×, 10× and 30× normal. Rivers in flood swell and glow.
- Hot pink means the gauge has passed the highest flow in its whole record. It stays pink once it does.
- The grey-blue veil is rain, hour by hour, from NOAA’s HRRR weather model.
- At the end the clock stops and the labels fill in: the new peak flow and the year of the record it beat.
December 8: the river in the sky
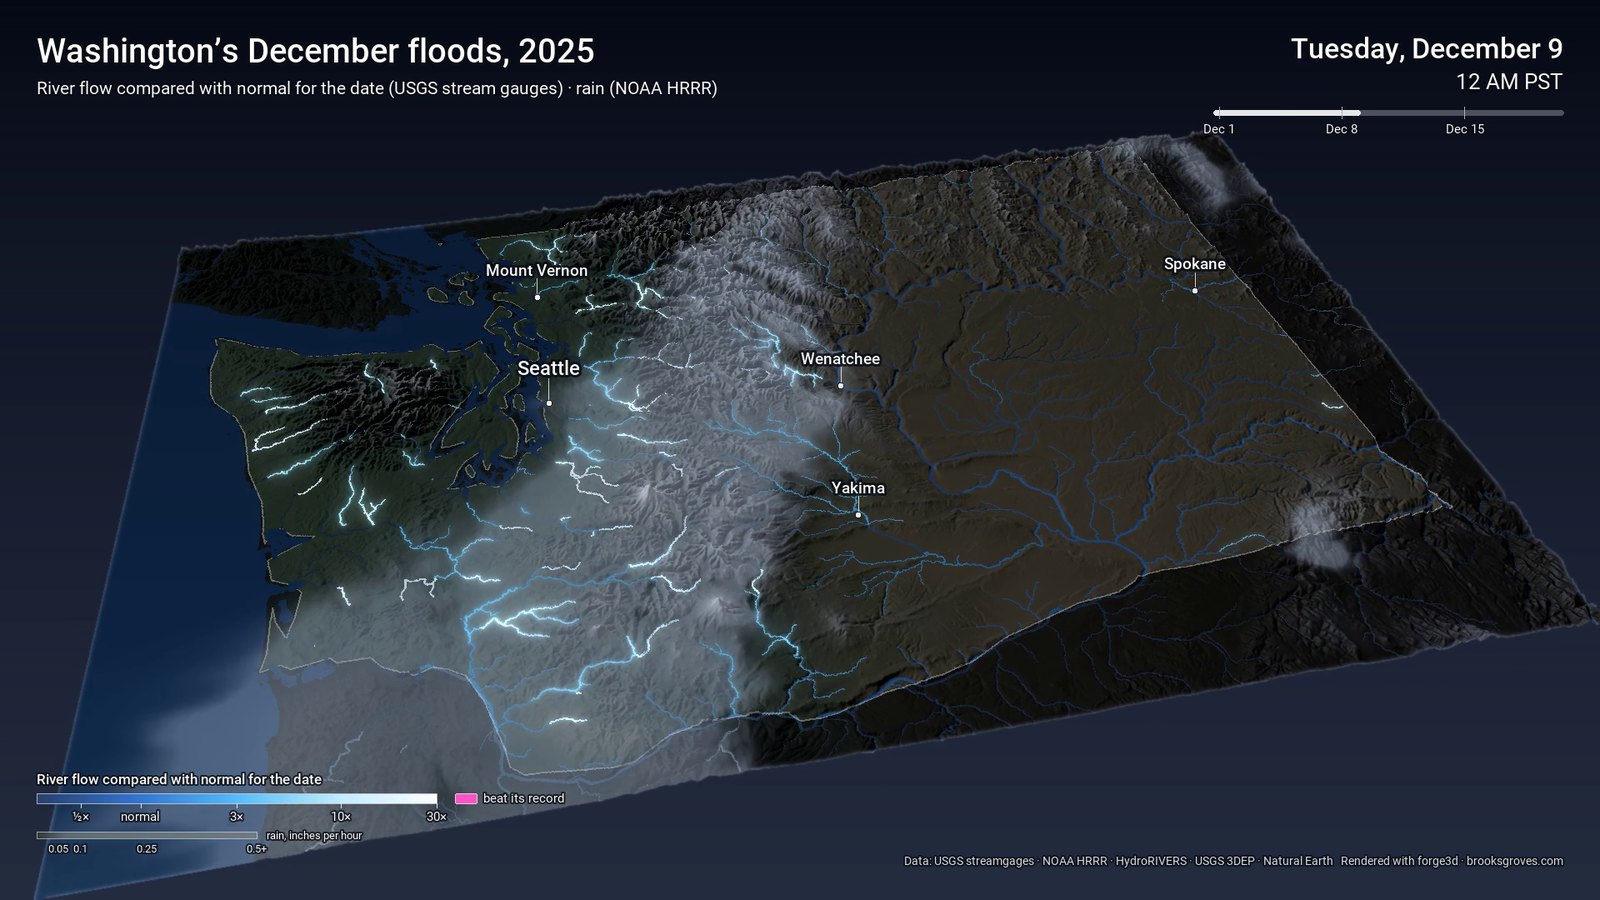
Midnight, December 9: the atmospheric river arrives and the west side starts to light up.
For the first week the map is quiet: rivers dim blue, running about normal for early December. Then on December 8 an atmospheric river comes ashore and stalls. For four days it fed warm, wet Pacific air into the Olympics and the Cascades. The lowlands got three to six inches of rain. The windward mountain slopes got ten to twenty, and the Lynn Lake weather station in the Cascades logged 21.8 inches. It was a warm storm, so it fell as rain far up the mountainsides, and the mountains sent it straight downhill.
You can watch it travel. The rivers on the Olympic Peninsula and the west slope of the Cascades turn white first, then the big lowland rivers fill as the water works its way down to the Sound.
December 10–12: the crests
On December 10, Skagit County told more than 75,000 people to leave. Around the state about 100,000 were under evacuation orders. The Skagit crested at Mount Vernon above its 1995 record, and the Snohomish at Snohomish passed a record that had stood since 1990. In Sumas two families were lifted off their roofs by helicopter. Ten rivers set all-time record crests, by the USGS’s count.
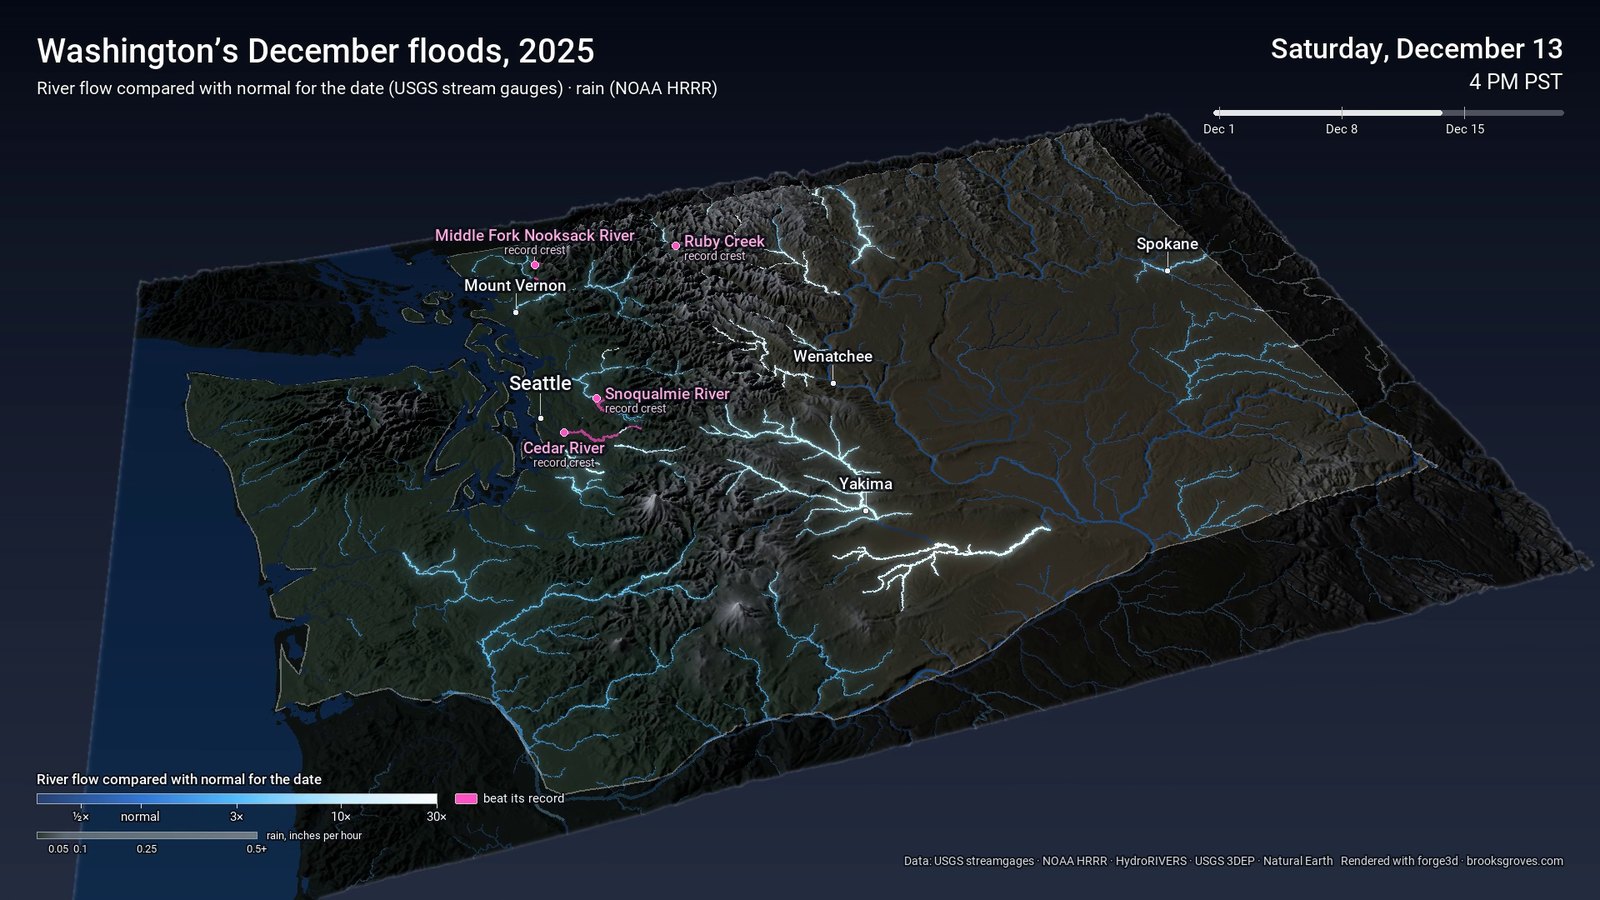
Saturday, December 13: four rivers labelled with record crests, and the Yakima side still running high.
Nine gauges on my map passed their record flows. The biggest pink line is the Snoqualmie at Carnation: about 88,900 cubic feet a second, past the 82,900 it carried in January 2009. The Cedar at Renton beat its 1990 record, and up north the Middle Fork Nooksack beat 2015 and Ruby Creek beat 2021. The east side flooded too. Rain fell high on the Cascades’ east slopes, and the Yakima, Wenatchee and Methow all ran high; Stehekin was badly hit. Washouts closed US-2 over Stevens Pass for weeks.
Why the Skagit isn’t pink
If you know this flood, you’ll notice the Skagit and the Snohomish, the two records in all the headlines, don’t glow pink. That’s not a mistake in the data, but it is a choice I made.
Flood records in the news are usually stage: how high the water stood on the gauge, in feet. My map uses flow: how much water went past, in cubic feet a second, compared with the highest annual peak flow on record. The two don’t always agree. A levee, a logjam or a changed channel can push the water higher with less of it, or let more through lower down. The Snoqualmie shows it the other way round: at Carnation it peaked about a foot and a half below its 2009 stage, while carrying more water than ever.
My flows are also hourly averages of the 15-minute readings, so they run a little under the true peak. A river that only just beat its record could stay blue on this map.
December 14–18: the second storm
The second storm arrived while the rivers were still high and the levees were soaked. Colder air brought snow to the mountains, which spared the rivers a second round of record crests, but the damage was done. The Desimone levee on the Green River breached on December 14 and a White River levee followed on December 16. A man was found dead in a submerged car in Snohomish, and the winds knocked out power to hundreds of thousands across the region.
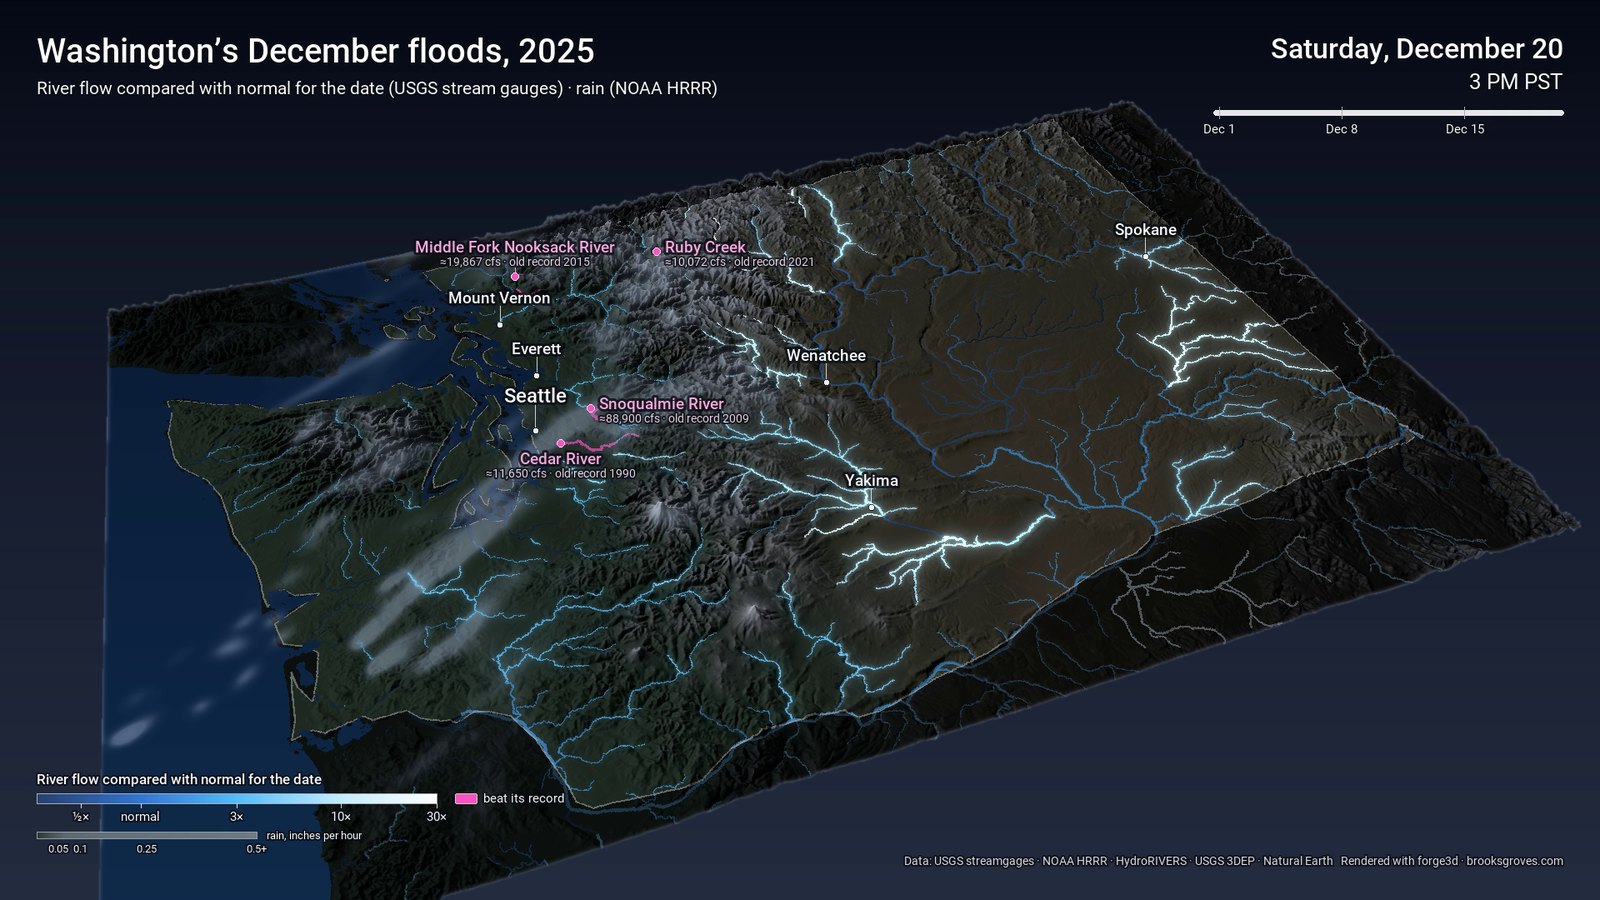
The final frame: each record crest with its peak flow and the year of the record it beat.
How it’s built
Same toolkit as the heat dome and smoke maps, with Milos Popovic’s forge3d drawing the terrain.
- Rain. 480 hourly HRRR files from NOAA’s open-data bucket on AWS, downloading only the one-hour rain field from each, about 1 MB a time.
- Gauges. The USGS Water Services gave me 15-minute flow from 307 gauges across the state, each gauge’s daily median flow for every December day over its whole record, and its annual peaks back to the start of its record. No API key needed.
- Rivers. HydroRIVERS, a global river network where every reach knows the reach downstream of it. Each gauge is snapped to a reach by distance and drainage area, and every reach takes the reading of the first gauge downstream, so a small tributary shows its main river’s story.
- Two renders a frame. As with the smoke, the land and rivers are rendered once and the rain again on its own, colour-coded so it survives the lighting, then laid over as a veil. The rivers are then redrawn on top so they glow through the rain.
“Normal” here is the USGS daily median for that calendar day. In early December the rain-fed rivers and the east-side rivers normally run low, so a moderate rise already reads several times normal. That’s why the Yakima basin goes white: it really was flooding, but it’s also starting from a low winter baseline.
Last thing
Whatcom County alone counted more than $23 million in damage. Behind each pink line are farms that went under, families who spent a week away from home, and road crews still rebuilding US-2. If you were one of them, I hope this winter is a drier one.
Data: USGS Water Services (instantaneous values, daily statistics, annual peaks); NOAA HRRR via the NOAA Open Data Dissemination program; HydroRIVERS v1.0 (Lehner & Grill 2013); USGS 3D Elevation Program; Natural Earth. Facts: Office of the Washington State Climatologist, Wikipedia, Snoqualmie Valley Record, The Watchers, The Weather Channel. Rendering: forge3d by Milos Popovic. Labels: Roboto.
Go deeper
Powerful floods batter the Pacific Northwest — Here & Now (NPR/WBUR), 17 December 2025, about 4 min. KUOW’s John Ryan on the second storm, the levees and the long recovery.
Rain, Wind, Heat: 2025 Weather in Review — Washington State Magazine webisodes (WSU), 26 January 2026, about 19 min. WSU AgWeatherNet meteorologists on the year, with a good stretch on the December atmospheric river.
Neiman, P.J., Schick, L.J., Ralph, F.M., Abel, M.R. & Wick, G.A. (2011). Flooding in western Washington: The connection to atmospheric rivers. Journal of Hydrometeorology 12(6), 1337–1358.
Ralph, F.M., Rutz, J.J., Cordeira, J.M., Dettinger, M., Anderson, M., Reynolds, D., Schick, L.J. & Smallcomb, C. (2019). A scale to characterize the strength and impacts of atmospheric rivers. Bulletin of the American Meteorological Society 100(2), 269–289.
Konrad, C.P. & Dettinger, M.D. (2017). Flood runoff in relation to water vapor transport by atmospheric rivers over the western United States, 1949–2015. Geophysical Research Letters 44(22), 11456–11462. Open access.
Warner, M.D., Mass, C.F. & Salathé, E.P. (2015). Changes in winter atmospheric rivers along the North American west coast in CMIP5 climate models. Journal of Hydrometeorology 16(1), 118–128.
Long-Duration Atmospheric River Produces Heavy Precipitation and Flooding in Pacific Northwest — CW3E event summary, December 2025; the storm by the numbers, AR-scale rankings included.
Flood science: How December’s atmospheric river soaked Washington — Kent Reporter, 2026; UW researchers on saturated soils and a snow line above 9,000 feet.
USGS Water Data for the Nation — every gauge, its history and its peaks. · NOAA Northwest River Forecast Center — river forecasts and observed flows. · NWS Seattle/Tacoma — the flood warnings.
NOAA HRRR on AWS — the hourly rain. · HydroRIVERS — the river network. · Washington State Climate Office — storm write-ups and historical context.
USGS 3D Elevation Program (3DEP) — the terrain. · forge3d — the Python terrain renderer. · wa-floods — this project’s code.