Seattle is not a hot town. Seattle is a town where people own three rain jackets and one pair of shorts, where “it’s a scorcher” means 84, and where, as of 2019, fewer than half the homes had air conditioning. We build houses to catch the sun, because most of the year there isn’t enough of it.
Then, the last weekend of June 2021, the sky parked a lid on top of us.
Washington, June 24 – July 1, 2021 · hourly 2 m air temperature, ERA5-Land reanalysis via Open-Meteo, adjusted for elevation · USGS 3DEP terrain, 3.5× vertical exaggeration · rendered with forge3d
Watch the clock in the corner. Thursday and Friday look like June. By Saturday the east side is orange. Sunday the orange crosses the Cascades. Monday afternoon the whole state goes red, and the Columbia Basin turns a color I had to add to the legend because red wasn’t red enough.
old record 103°
old record 107°
ties WA record
Canada record
Wait, how hot?
Sea-Tac’s all-time record going in was 103°F, set in July 2009. The airport hit 102 on Saturday, which was already absurd. Sunday it hit 104, a new record. Monday it hit 108, and broke the record it had set the day before. Portland, which had never seen 108 either, did 108, then 112, then 116, three days running.
And my favorite, if “favorite” is the word: a weather station on the Sol Duc River near Forks, in the rain forest, touched 118°F and tied Washington’s all-time state record. Moss country. The place tourists go to get rained on.
Across the border, Lytton, B.C. set Canada’s national record three days in a row, finishing at 121°F (49.6°C) on Tuesday. The next day, the village burned.
Meanwhile, back home: shops at Pike Place closed early. Hotels filled up with people who just wanted a room with AC. I-5 buckled. The National Weather Service warned that pavement could hit 170°F, which is a hazard for your tires and a much bigger one for your dog’s feet.
Why it happened
A heat dome is a big, stubborn ridge of high pressure that parks overhead and won’t leave. Air under it sinks, and sinking air heats up as it’s squeezed. There are no clouds, so the sun cooks the ground all day, and the ground doesn’t get a chance to cool off at night. In 2021 it came with a kicker: east winds pushing air down the west slopes of the Cascades, heating it even more on the way down, and keeping the cool ocean air, the thing that normally saves us, offshore.
You can see the ocean air win at the end. Here’s Tuesday evening:
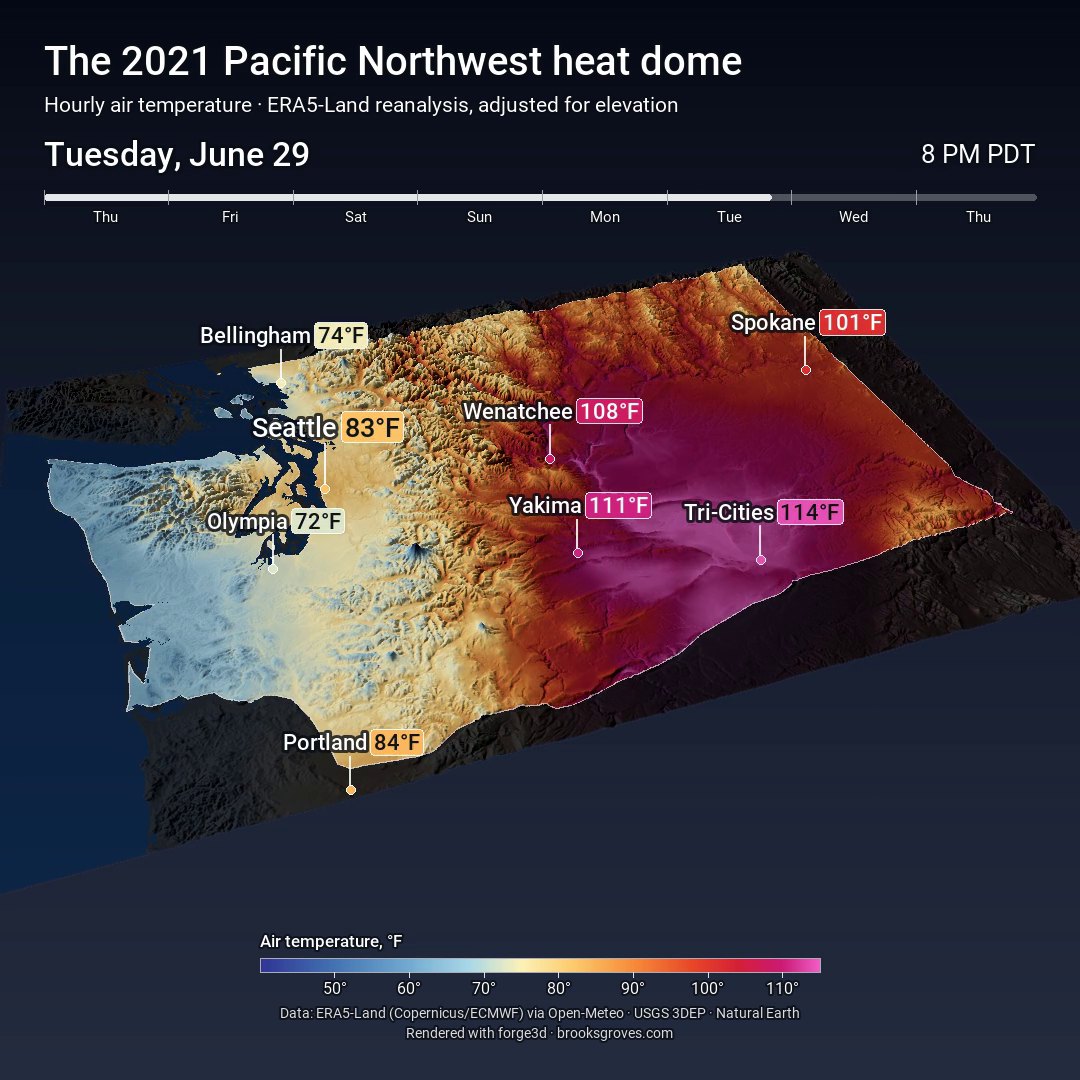
Tuesday, June 29, 8 PM · the marine air is back west of the Cascades. Seattle has dropped to 83. The Tri-Cities are still at 114.
The marine air pushed back in on Tuesday and the west side dropped like a stone: in the reanalysis, Seattle goes from 106 on Monday afternoon to 83 by Tuesday evening. The east side didn’t get the memo. The heat just slid over the mountains and sat on the Columbia Basin for a few more days.
The part that isn’t fun
Washington’s Department of Health counted 100 heat-related deaths in the week of the heat dome, with the worst of it on Monday and Tuesday. Our buildings are made for a climate that no longer quite exists.
A few days later, an international team at World Weather Attribution ran the numbers. In today’s climate, heat like this is roughly a 1-in-1,000-year event. Without human-caused warming it would have been at least 150 times rarer: in their words, “virtually impossible.” At 2°C of global warming, they estimated, it becomes something like a once-every-5-to-10-years event.
So, fun map. Keep a fan in the closet anyway.
How it’s built
This is the same toolkit as the Humphreys Peak orbit, pointed at a much bigger problem. Milos Popovic, who wrote forge3d, has been making gorgeous animated maps of wildfire smoke and heat waves, and I wanted to try one on home turf.
- Temperature. Hourly air temperature from ERA5-Land, the European reanalysis, on a 0.1° grid (about 9 km) — 3,060 points over Washington, 192 hours, pulled from Open-Meteo’s free API in about seven minutes.
- Terrain. USGS 3DEP elevation for the whole state at 250 m.
- Downscaling. A 9 km grid cell averages a mountain and its valley together. So each 250 m pixel gets nudged by the standard lapse rate — about 3.6°F cooler for every 1,000 ft above the cell’s average height. That’s why the Cascades and the volcanoes stay blue while the valleys cook.
- The render. One temperature map per frame, draped over the terrain in forge3d, with a slow camera drift. 765 frames, four per simulated hour.
- The finish. Plain Python adds the labels, the clock, the week timeline and the legend, and hands it all to ffmpeg.
Reanalysis is a model’s best reconstruction of the weather, so it’s smoother than a thermometer on a pole. It still got closer than I expected: it has Seattle at 107 at 4 PM Monday, one degree under the official 108. It’s softer on the extremes: Portland comes out 112 instead of 116.
Three things that fought back
Washington was too big. forge3d’s viewer caps how far the camera can back away — 50 km, plenty for one mountain. Washington is about 600 km wide. The camera would silently stop at the limit and I’d get a very detailed view of central Washington. The fix was to shrink the state: the terrain the viewer sees is Washington scaled down to 45 km across, with the heights scaled to match, and my label maths does the same conversion.
The water came out grey no matter what colour I painted it, because the renderer lights flat water like a sheet of brushed metal. So I cheated like a TV weatherman: the ocean is painted bright green-screen green, which no temperature on the scale uses, and the finishing pass keys it out and paints in deep Pacific blue.
115°F looked like salmon. The terrain lighting was bleaching the reds into pinky-orange. forge3d has a mode that keeps the overlay’s colours true and lays the shading on top instead, and switching to it was the difference between “warm” and “damn.” I also moved everything to a dark background and pushed the top of the scale to hot pink, so the worst of it glows instead of disappearing.
One more thing
I rendered this one at three sizes, for the blog and for the feeds. If you’re in the Northwest, you probably have a story from that week. Tell me yours in the reactions below.
Data: ERA5-Land (Copernicus Climate Change Service / ECMWF) via Open-Meteo; USGS 3D Elevation Program; Natural Earth. Facts: HistoryLink, NOAA Climate.gov, Washington DOH, World Weather Attribution. Rendering: forge3d by Milos Popovic. Labels: Roboto.